


Introduction
Debugging is arguably the most important step in software development. Without the use of Debugging tools, and knowledge on how to use them, proper software development would not be possible. This article will introduce you to the world of debugging and debugging tools.
The Software Development Process
Now, any programmer, whether it be beginner or advanced, should know that you cannot just jump in and code, although I have seen code cowboys doing that, only to be hung with their own lassos at the end of the day. Neither can you code a program and just forget about it. Surprisingly,s many a professional programmer forget the importance of debugging, as well as testing. I will speak about testing in a later article,
There are four steps in the software development process. These four steps are:
- Planning
- Coding
- Testing & Debugging
- Implementation
Debugging
Debugging is the process of finding and correcting bugs (errors) in your programs. Finding errors can be quite a daunting task, especially if you do not know what tools are your disposal and how to use them. There are three types of errors:
- Syntax errors
- Run-time errors
- Logic errors
Syntax Errors
Syntax errors can be defined as errors in your code. Some of these errors might be glaringly obvious because a syntax error is an error in your code. This can be a misspelling of a keyword or an object name. Although this is the easiest error to find and fix, it can be quite difficult to find if you have thousands of lines of code and are quite pressed for time.
Run-time Errors
A runtime error usually occurs when a user has done something wrong, or your program is syntactically correct, but produces the wrong results
Logic Errors
A logic error simply resembles a flaw in the logic of your program. This type of error produces the wrong desired results.
How to Debug a Program
Debugging programs is an art form in itself and most everyone has a different approach on how to tackle the debugging process. I have a problem which is that I always end up thinking about the bigger picture of an error and tend to forget everything else. Sometimes, though, I think the problem lies somewhere specific; this ends up not being the original source of the error at all. I cannot teach you how to debug, or how to approach debugging because every program is different; but what I can tell you is what tools are out there to assist in finding your errors.
The Debug Menu
Let me start with the Debug menu, which looks like Figure 1.
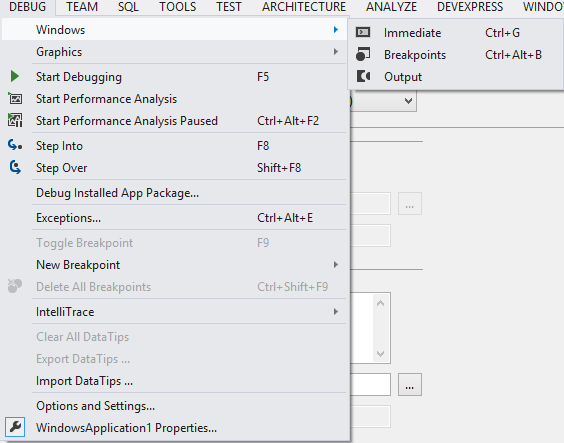
Figure 1: The Debug menu
The debug menu is a shortcut for accessing any and all debugging features available. The first item in the list is the Debugging Window.
The Debugging Window
There are three Debugging menus:
- Immediate
- Breakpoints
- Output
The Breakpoints Window
As displayed in Figure 2, the Breakpoints window shows a list of breakpoints currently in your program. It also shows how many times the breakpoint has been reached.

Figure 2: Breakpoints window
Setting Breakpoints
Setting a breakpoint is very easy. All you need to do is to be on the desired line of code and click inside the margin, or press F9. A line with a breakpoint looks like Figure 3.
![]()
Figure 3: Breakpoint
When a breakpoint is reached, the whole application will pause, allowing you to check the values of your objects, with the aid of the Autos Window, Call Stack Window, Locals and Watch Window.
Performance Analysis
This item allows you to analyse performance issues within your program. A summarized view is displayed in Figure 4.

Figure 4: Performance Analysis
There are several windows available in the Performance Analysis window; these windows include:
- Summary
- Call Tree
- Modules
- Caller/Callee
- Functions
- Lines
- Marks
- Processes
- Function Details
Step Into
Once a breakpoint has been hit, using Step Into allows you to enter the desired function or sub at the specific breakpoint. For example: Let’s say you set a breakpoint at the line at which a function or sub will be called. Using Step Into will enter the function or sub and allow you to step into each line of code. This is handy when you want to see the results of a function or sub or even a line of code. You can determine whether a variable’s value has been set to the appropriate value or not.
Step Over
Using Step Over will not do what Step Into does; well technically yes, but no. It will simply just step over the line of code and not give you the ability to manually enter the function or sub that has been called. It will, however, still give you the little hints on the values of the objects currently being processed.
Step Out
Step Out allows you to exit a function or sub currently being interrogated by the debugger.
Exceptions
The Exceptions window looks as follows:
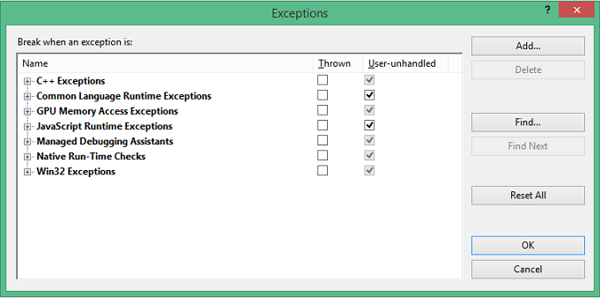
Figure 5: The Exceptions Window
Inside the Exceptions window, you can choose whether or not the compiler should throw an error. This approach is not recommended for beginner users.
Conclusion
That wraps up today’s article. Until next time, happy debugging!