

By now, you probably know that there are a lot of fancy new high-end features coming in Microsoft SQL Server 2005. But, in its quest to conquer the data center, Microsoft hasn’t forgotten the end user. In fact, there are more new features for desktop users and business analysts than ever before. One good example of these features is Report Builder. For the first time, SQL Server is shipping with an end-user reporting tool right in the box. After a little setup by the DBA, your end users can create their own attractive and informative browser-based SQL Server reports (assuming you’ve installed the Reporting Services component of SQL Server). There was nothing comparable in previous versions of SQL Server, and the new capability looks likely to be a big hit.
Setting up a Data Model
Report Builder doesn’t give end users carte blanche to explore a SQL Server database—most DBAs would be horrified at such a thought. Instead, it depends on the notion of a data model, a preselected group of tables and relationships that the DBA has identified as suitable for ad hoc reporting. The first step in preparing for Report Builder, then, is to set up a Data Model. To do so, you launch SQL Server Business Intelligence Development Studio. This is the all-purpose IDE for BI programming tasks in SQL Server 2005, derived from the Visual Studio 2005 codebase. The first step is to create a new Report Model Project; I named mine AWSales.
The new project will display three empty nodes in Solution Explorer: Data Sources, Data Source Views, and Report Models. To populate the project, I followed these steps:
- Right-click on Data Sources and select Add New Data Source. Use the Add New Data Source Wizard to add a connection to the local copy of the AdventureWorks database.
- Right-click on Data Source Views and select Add New Data Source View. Use the Data Source View Wizard to add a view based on the Adventure Works data source.
- In the Data Source View Wizard, select the Production.Products and Sales.SalesOrderDetail tables; then click the Add Related Tables button to bring in the Sales.SalesOrderHeader and Sales.SpecialOfferProduct tables.
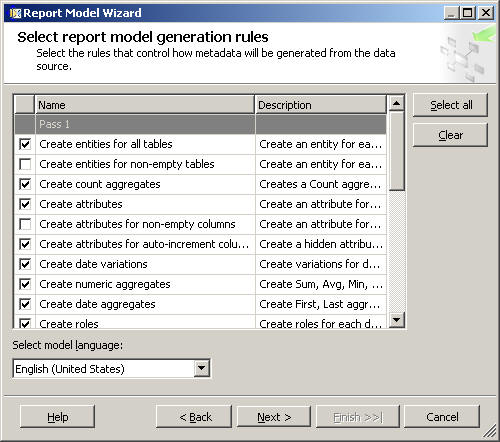
- Right-click the Report Models node and select Add New Report Model. In the Report Model Wizard, select the Adventure Works data source view and click Next. The next step is to select the rules that will be used to generate the report model, as shown in Figure 1. I used the default rules. It’s these rules that create the entities that will be available to end users for reporting.
- Click Next, choose to update the database statistics, and click Next again to finish the Wizard and build the report model.
At this point, the report model is complete, but it’s not yet available to end users. The final step is to select Deploy from the Build menu to push the report model to the Reporting Services server. This publishes the report model so that it will be available to end users in Report Builder.
Launching Report Builder
Report Builder itself is a ClickOnce WinForms application. That means that end users install it from the browser, but once installed it’s not a browser-based application. To get started with Report Builder, browse to your Reporting Services home page—typically, this will have a URL something like http://MySqlServer/Reports (or http://localhost/Reports if you’re running the browser on the same box with SQL Server 2005 itself). Click the Report Builder link in the home page menu bar to install and launch Report Builder.
Report Builder will load with the New Report dialog box visible, showing all the available report models. Select the Adventure Works model and click OK. Figure 2 shows the result: Report Builder ready to build a report.
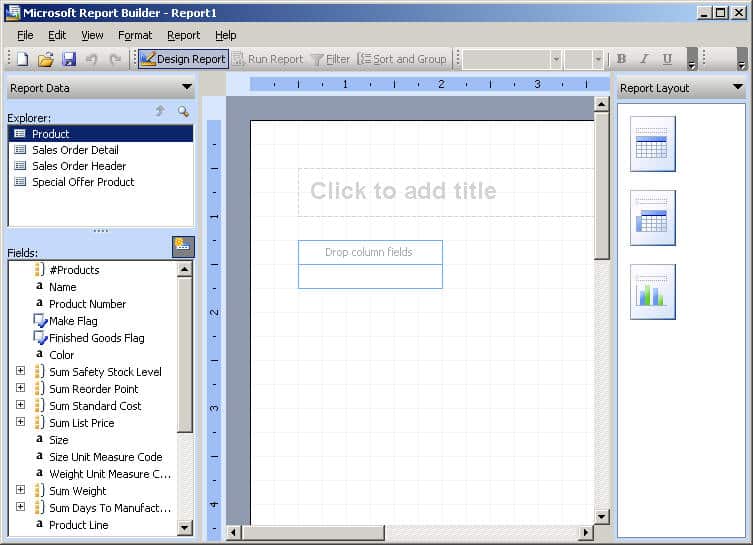
To the left, the Explorer window shows all of the tables in the report model. Beneath that, the Fields window shows the entities in the selected table. Note that not everything in this window is a colum in the table; the report model also creates aggregate entities such as Sum List Price and calculated fields such as Sell End Year. In the center of Report Builder you see the report layout area where you build the actual report. To the right is the Report Layout gallery, where you can select the default tabular report, a matrix report, or a chart report.
Note that Report Builder also installs its own extensive help when it installs itself. This help remains available on the end user’s computer, and explains the basic concepts behind Report Builder. It also contains a great deal of how-to information for the analyst who wants to construct reports. (As of the June 2005 CTP build of SQL Server, the Report Builder help file is still quite unfinished).
Building a Report
The Report Builder designer is a drag-and-drop environment. To use it, you drag entities from the field list and drop them on the design surface. For example, with the Products table selected, drag the Name field and drop it in the area marked Drop Column fields. Then, double-click on Products in the Explorer window to show related child tables. Select the Sales Order Details table, and then drag the Sum Order Qty field and drop it to the right of the Name field. Click the Run Report toolbar button to produce the report shown in Figure 3.
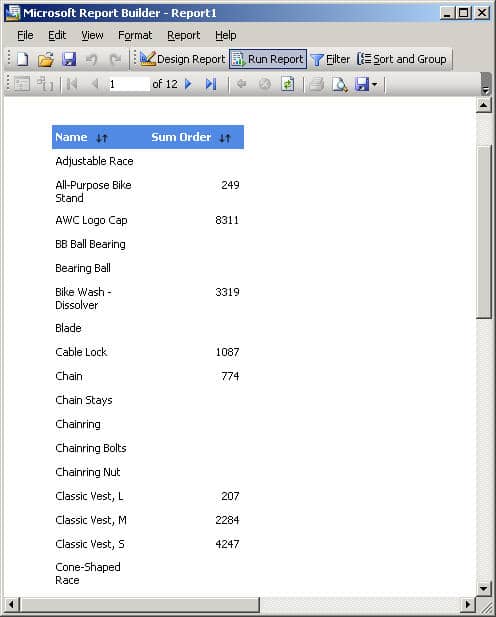
Note that you can adjust some of the report’s properties interactively even while you’re viewing its data. For example, click the Sort and Group button to select up to two sorting and one grouping fields. I chose to sort by Sum Order Qty descending. Changes you make to sorting, grouping, and filtering are saved with the report definition; they’re not merely temporary.
Publishing a Report
You can, if you like, use Report Builder strictly as a tool for exploring data on your own desktop. But, you also use it to build reports that are shared with others in your own organization. That’s because Report Builder can easily make the loop back to Reporting Services by publishing its reports to your Reporting Services server.
To publish a report, first use Report Builder to tweak the design to your liking. Then, select Save from the File menu. The default save location is the home folder on the Reporting Services server that hosts the data model that you’re working with. Give your report a name, click OK, and it will be available to anyone else who can browse to the Reporting Services home page.
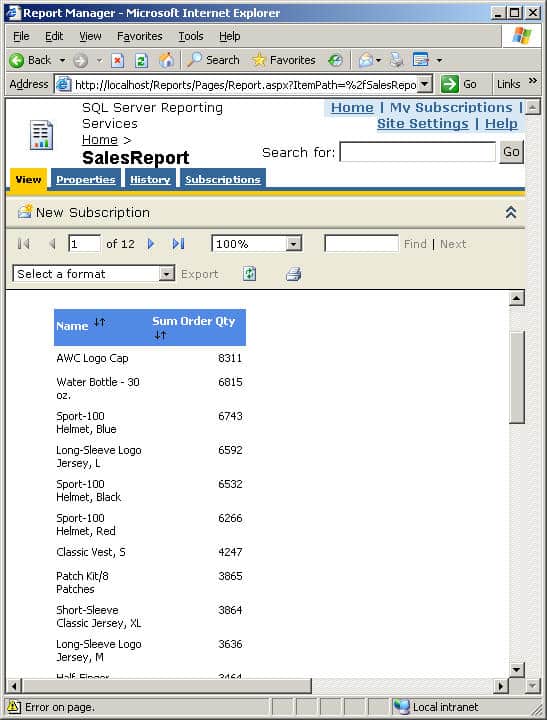
After you publish a report, it’s completely independent of Report Builder. Other users can open it directly in the Reporting Services browser-based interface, as shown in Figure 4.
Going Beyond the Basics
As I promised in my title, that’s the barest of introductions to Report Builder—just enough to give you a hint of its promise. But, there’s a lot more to this polished tool. In addition to tabular reports, it can build crosstabs and charts. The design environment offers you full control over formatting, fonts, colors—indeed, the entire range of look and feel properties for your reports. You can export reports to a variety of formats, including XML, CSV, and PDF. You can even create “ClickThrough Reports,” where clicking on data unfolds more detailed reports with additional information.
With the introduction of Report Builder, Microsoft has added a well-designed end-user reporting capability to SQL Server. By basing reports in explicit data models, Report Builder overcomes the objections that DBAs have to completely ad hoc tools that can drag down the performance of a database. By making the report design and formatting engine easy to use and flexible, Report Builder allows end users to see data the way they want it, without waiting for overburdened DBAs and developers to respond to change requests. It’s a big win all around, and I’m looking forward to seeing it deployed in action.
Abut the Author
Mike Gunderloy is the author of over 20 books and numerous articles on development topics, and the lead developer for Larkware. Check out his latest books, Coder to Developer and Developer to Designer, both from Sybex. When he’s not writing code, Mike putters in the garden on his farm in eastern Washington state.