


In SQL Server Management Studio there is a view option known as “Include Client Statistics”. Do you know what client statistics are? If you search the Microsoft documentation, you may find the description a little lacking. When I searched, I found only two references to these statistics. One reference said “…contains statistics about the query and about the network packets, and the elapsed time of the query”. The second one said “…Displays information about the query execution grouped into categories”. If you are like me, you might be thinking something along the lines of “That really doesn’t help me understand exactly what client statistics are”. With that in mind, this database tutorial will show you how client statistics work and explain how they might be useful when you are writing and debugging your TSQL code.
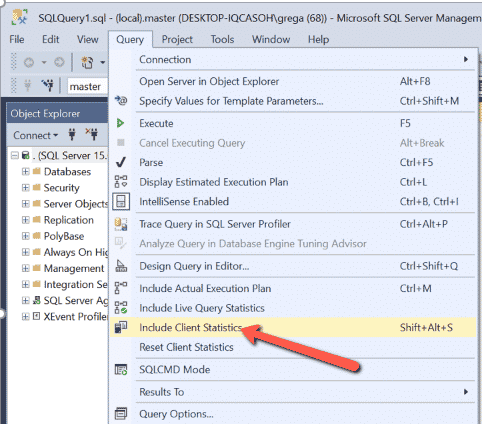
To view client statistics, you need to turn on the “Include Client Statistics” option. One way to turn these on are to use the “Include Client Statistics” in the Query menu, as shown below:
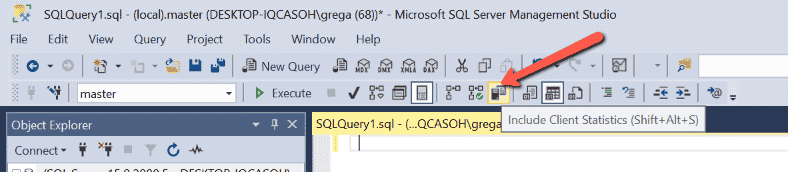
Alternatively, you can use the “Shift+Alt+S” keyboard shortcut. When you turn on “Include Client Statistics”, the statistic will be displayed each time you execute your TSQL from a query window. Another way to turn on client statistics is to click on the “Include Client Statistics” button in the toolbar as shown below:
To show you some client statistics let’s run the following query while the “Include Client Statistics” option is enabled:
USE AdventureWorks2019;
GO
SELECT * FROM Sales.SalesOrderDetail
WHERE SalesOrderID > 1000 and SalesOrderDetailID < 2000;
After running this query, a new tab called “Client Statistics” is displayed in the results pane as shown below:
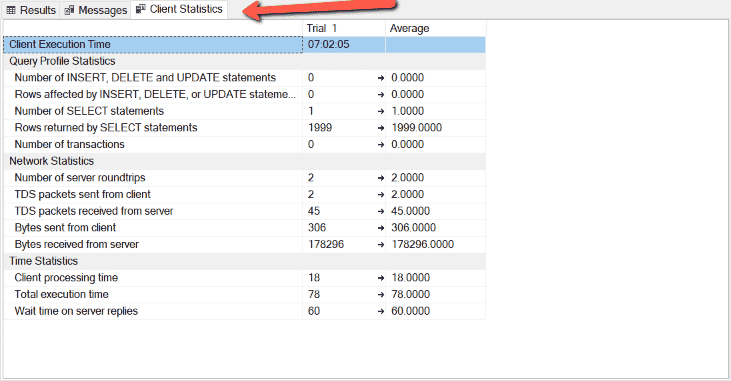
In this tab, you can see a number of different statistics that are grouped into the following categories:
- Query Profile Statistics
- Network Statistics
- Time Statistics
“Query Profiler Statistics” shows some interesting numbers related to the types of commands and rows returned by the query. The “Network Statistics” show you statistics regarding the network packets and the number of bytes sent to a server and returned from a server. This network information can help you identify the amount of network traffic that a query causes when it is executed. The larger the number of bytes identified, the more network bandwidth the query uses. The last grouping, “Time Statistics”, shows information about the time spent in different areas, while processing a query.
If you look at the columns displayed in the screenshot above, you can see the “Trail 1” and “Average” columns. The “Trail 1” column represents the statistics from the first execution of the TSQL code. Since I have only run the TSQL code once, you can see the “Average” shows the same numbers as the “Trail 1” column. The “Average” column is more useful after more than one execution has occurred. So let’s run the test query two more times.
After running it twice, here is what the client statistics tab now shows:
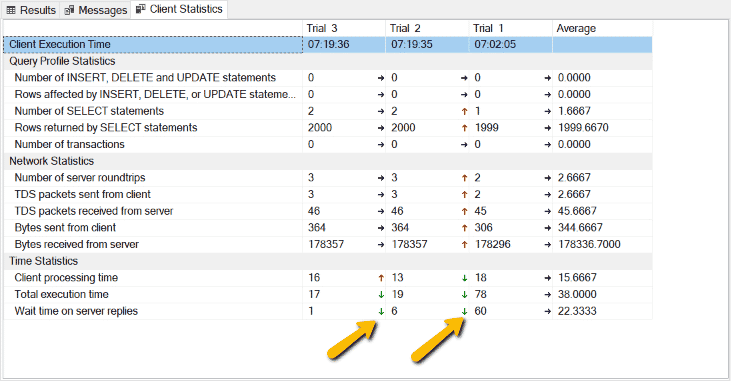
As you can see, we now have the client statistics for two more trials – 2 and 3. These are the statistics for the second and third execution of our TSQL code. Plus, now the “Average” column contains statistics that are averaged across all three trial executions. Additionally, you can see some little green, red, or black arrows displayed that we have pointed to with the big yellow arrows in the screenshot above.
These arrows indicate whether the numbers went up, down, or stayed the same between each subsequent trial execution. The little red arrow indicates that the number went up since the last trial execution. The little green arrow tells us that the number has gone down from the previous trial. Lastly, the little black arrow shows that, between both trials, the number stayed the same. These little arrow indicators help you quickly identify if the stats are trending up, down, or staying the same between trials, without looking at the actual numbers.
Next time you want to know how much network traffic a client query is causing, are looking to identify averages, or trends between different executions of a given query, you might consider turning on client statistics so you can follow the trends and averages over multiple executions of the same query.