

What Tracer Is
Tracer is a simple standalone tool that displays useful information for testing/debugging MFC applications. Initially, I made this tool to make programmers’ life easier when tracing complex workflows and seeing the long dynamic-built SQL queries. It proved to be much more useful and I extended its using even for intermediary release versions of applications intended to be tested at the client. That saved a lot of time in reporting/finding/fixing troubles that occurred.
Its main advantages are:
- Allows you to see messages easier than in the ‘Output’ window of Visual Studio. Also, it’s easier than looking in log files.
- Does not require Debug mode as for the ‘Output’ window. It can be used in any type of build configuration (either Debug or Release) and can be easily enabled/disabled by declaring or not a preprocessor constant (USE_TRACER).
- Each type of message—‘general debug info’, ‘SQL statement’, and ‘error’—is displayed with a different color.
- You can filter the type of messages to be displayed. For example, you can choose to display only the ‘error’ messages.
- It displays additional info for each message, such as source file name, line number, and timestamp.
- Its contents can be saved in a file.
How It Looks
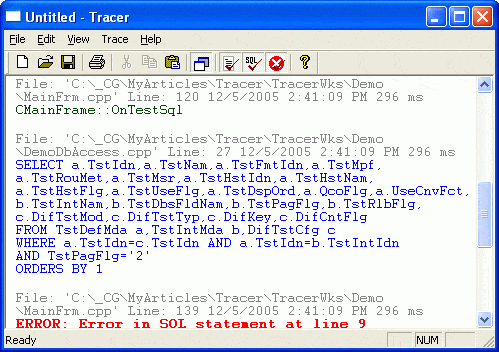
As shown in the figure above, it is an SDI application that uses a Rich Edit view. Besides the standard menu items/toolbar buttons, it has a few additional ones to toggle always on top and to filter message types.
How It Works
It simply handles WM_COPYDATA message that is one way to pass data between processes. The COPYDATASTRUCT sent with WM_COPYDATA contains the string to be displayed and the message type.
To allow your application to send messages to Tracer, you have to link it with TraceSender.DLL, which effectively searches for the Tracer window and sends to it WM_COPYDATA. See the source code for more implementation details.
Using Tracer with Your Application
- Include "TraceSender.h".
- Link your application with TraceSender.lib using #pragma comment(lib,…); for example:
#ifdef USE_TRACER
   #pragma comment(lib,_T("\\MyProject\\lib/TraceSender.lib"))
#endif USE_TRACER
Demo Application
It’s a simple application having a few dummy functions intended just to demonstrate the use of the DEBUG_TRACE, SQL_TRACE, and ERROR_TRACE macros. Below is a sample code snippet.
void CMainFrame::OnTestSql()
{
   DEBUG_TRACE(_T("CMainFrame::OnTestSql"));
   // ...
   try
   {
      CDemoDbAccess db;
      // SQL_TRACE is called from db.ExecuteSQL
      db.ExecuteSQL(strSQL);
   }
   catch(LPCTSTR pszDemoException)
   {
      ERROR_TRACE(pszDemoException);
   }
}
void CDemoDbAccess::ExecuteSQL(LPCTSTR pszSQL)
{
   SQL_TRACE(pszSQL);
   // ... this is just an example; may be any other error here ...
   throw(_T("You have an error in SQL statement at line 9."));
   // ...
}
Final Notes
If, let’s say, for a stable considered version of your application, you don’t need tracing anymore, you can simply remove USE_TRACER from the preprocessor definitions (or create a new build configuration with no USE_TRACER constant). That way, the TraceSender macros will be ignored, and will no more affect the application speed/size performance.
The article describes how to use Tracer for an MFC application made with VC++ 6.0. However, I think there is not any problem using it in newer versions of VC++.