

Introduction
Dundas data visualization provides third party chart controls for developers used for creating embedded chart based RDL reports with SQL server reporting service. Dundas also provides gauge, map and other visual controls for different Microsoft development platforms (ASP.NET, Windows Forms, SQL Reporting Services and SharePoint). Dundas charts for reporting services can be very easily incorporate into RDL reports and easy to use. These chart control offers more features, additional graph types and more reporting abilities.
Developers can now easily convert existing SQL reporting services charts by right-clicking on a native graph and converting it to Dundas chart. You can download an evaluation copy from the following URL: http://www.dundas.com/Components/Downloads/index.aspx
Development Environment Setup
Before installing Dundas chart you must configure your Microsoft Visual Studio environment (need to install SQL server business intelligent development studio) for creating RDL report files. After installation of Dundas Chart, Microsoft Visual Studio Toolbox will have Dundas chart control in it.
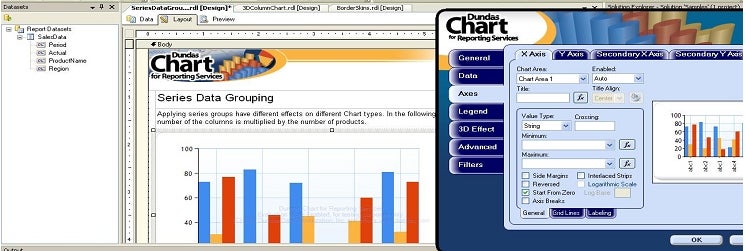
Figure 1
Like any other .NET toolbox control you need to drag Dundas chart to report design view to use it. To add a new chart in your report drag and drop Dundas chart in report layout. This will open a wizard. First you need to select chart type from the dropdown and appearance theme. You can also create 3D charts by checking ‘3D enable’ check box.
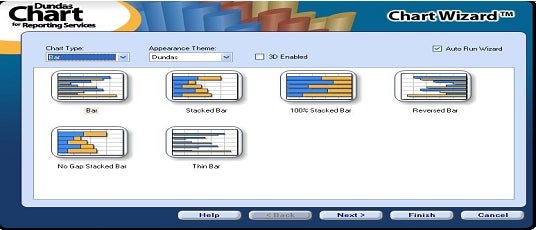
Figure 2
Next you need to create a data source (dataset) for the chart report and configure fields to be shown in the report. You can also create groups and sub groups using this screen.
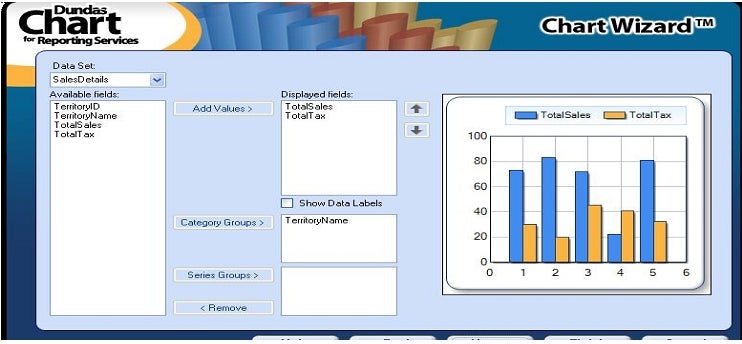
Figure 3
The following SQL query is used to prepare test data (dataset) shown in the report.
  SELECT     4 AS TerritoryID, 'Southwest' AS TerritoryName, 31213459.5756 AS TotalSales, 2028874.8724140 AS TotalTax
  UNION ALL
  SELECT     6 AS TerritoryID, 'Canada' AS TerritoryName, 21501812.4574 AS TotalSales, 1397617.8097310 AS TotalTax
  UNION ALL
  SELECT     1 AS TerritoryID, 'Northwest' AS TerritoryName, 20802600.7782 AS TotalSales, 1352169.0505830 AS TotalTax
  UNION ALL
  SELECT     9 AS TerritoryID, 'Australia' AS TerritoryName, 12197515.5294 AS TotalSales, 792838.5094110 AS TotalTax
  UNION ALL
  SELECT     5 AS TerritoryID, 'Southeast' AS TerritoryName, 10570580.4225 AS TotalSales, 687087.7274625 AS TotalTax
The resulting set of the above SQL query is shown in the following screen-shot.
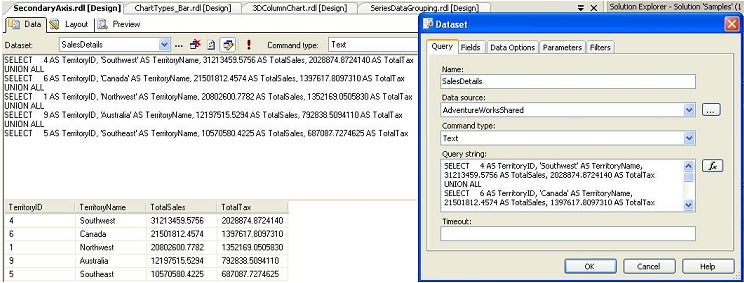
Figure 4
Clicking on the data tab of the RDL report opens the dataset configuration window. You can mention your dataset name and SQL statement that will be used to show report data. You can also mention stored procedure name with parameters in this window. Stored procedure parameters can be hard coded value or you can pass a value while report execution (run time) using report parameter options. While uploading the RDL report to report server data source and report parameters needs to be reconfigure.
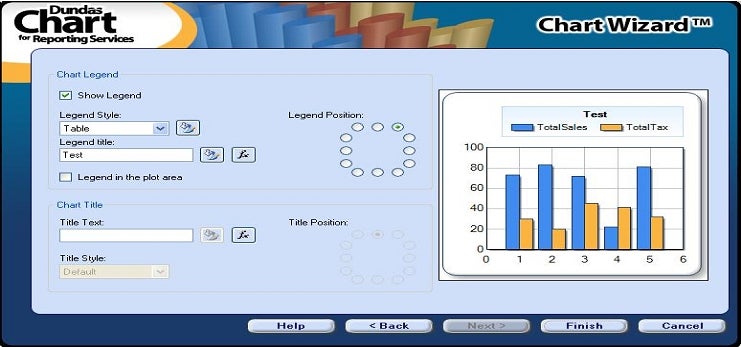
Figure 5
On the next screen of the wizard you can set legend style, legend title, chart title, legend position etc. Legend position can be rotated 360 degree.
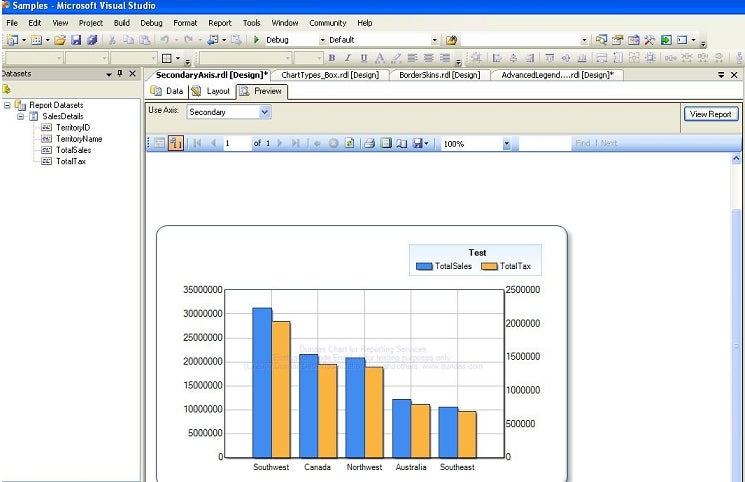
Figure 6
Next to see output of the report click on the preview tab of your RDL (Report Definition File). In this example I have shown country wise sales report and total tax paid per country wise. In X axis I have shown the country name and in Y axis total sales and total tax paid.
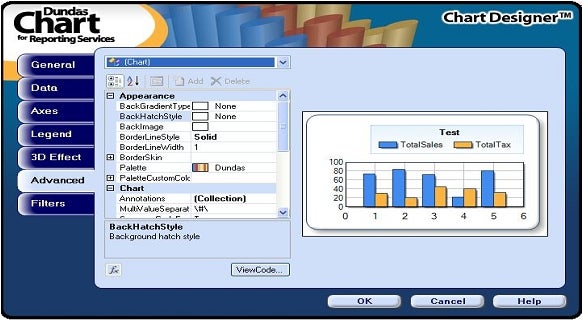
Figure 7
Advance Chart Properties
Advance chart configurations can be changed from the properties window. Using property window you can change default property of X axis, Y axis, secondary X axis and secondary Y axis. Advance properties can also be used to set font, color, margin, grid type, line style etc.

Figure 8
Integrating your RDL with ASP.NET Web Application
A RDL report with Dundas chart is a server side processing file. To use this RDL report in local ASP.NET web application, this needs to be converted to RDLC report. Next I have created an ASP.NET web application project using Microsoft Visual Studio 2008 and .NET framework 3.5 and added the converted RDLC file to the newly created project.
Next I have added a web form (.aspx page) where I have shown the report output. To render RDLC report I have also added a report viewer control to my web form and selected RDLC file in the ReportViewer tasks smart tags panel. Using choose data sources I have selected required data sources for this report.
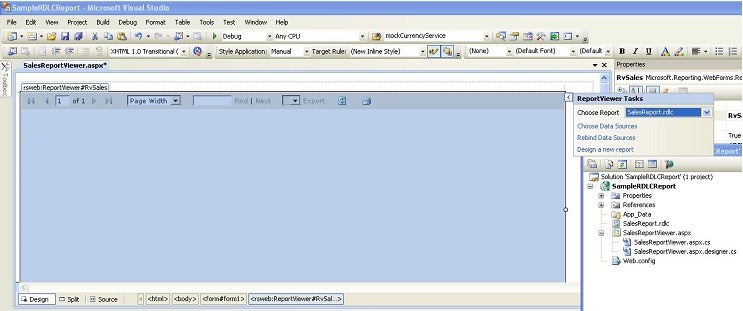
Figure 9
Once all the configurations are complete I pressed F5 to compile and execute my report viewer application.
Conclusion
Microsoft has acquired Dundas data visualization intellectual property in April 2007. New chart and gauge report items are already released as part of SQL server reporting services 2008 more Dundas controls will be incorporated with next version of SQL server reporting service release.