


In this article, you will see how Qt is installed on a Raspberry PI3 and learn how to develop a 2D charts library. The library can be integrated with any real time data collection software to display its run time data.
The Raspberry PI3 (model b) is mostly used with the proprietary OS Raspbian, which is available at raspberrypi.org/downloads. Raspibian is a Debian flavored version of Linux that has good support for third-party software available through an apt-get software management utility. Qt5.3 is among these apps that can be installed through the ‘apt-get install’ utility.
You should note that the Qt installed in this article works as a desktop application with the X11 protocol on the back end. It does not support embedded eglfs or wayland window manager, available for eglfs display. It is currently used on the Raspibian PIXEL window manager with the X11 display server concept. For higher versions of Qt (>5.3), Qt source code can be natively built on rPI3 or for eglfs, cross compilation can be done on the desktop (such as Ubuntu).
Installing Qt
You’ll want to start the Qt install with the following command:
pi@rapberrypi:~ $ sudo apt-get install qt5-default
If Qt creator (IDE) and Qt documentation (help page) are required, the qtcreator can be installed. Do the following command:
pi@rapberrypi:~ $ sudo apt-get install qtcreator
The Qt version can be checked with the following command:
pi@raspberrypi:~ $ qmake -version
QMake version 3.0
Using Qt version 5.3.2 in /usr/lib/arm-linux-gnueabihf
Working with the QWidget, QMainWindow, and QPainter Classes
Qt windowing support is available through the QWidget class. Instantiating QWidget pushes a window which can take user input through a keyboard or mouse.
QWidget w;
w.show()
QMainWindow is custom widget sub-classed from QWidget and adds Menus, Toolbar, Statusbar, Dockable widget, and a Central widget to a window.
QPainter is a class which actually does the painting on the window (QWidget). The user needs to set the Pen (for line), Brush (for background), and Font (for text) attributes of the QPainter object. It implements painting functions like drawLine(), drawArc(), and so forth. QPainter generally is instantiated within the paintEvent() function, which is a callback function for the QPaintEvent event. QPaintEvent is triggered by the update() or repaint() function call or by a window manager when the window requires repainting.
Working with the Chart Class Features
chart is subclassed from QWidget and becomes a central widget to mainwindow (subclassed from QMainWindow).
QMainWIndow              QWidget
   / \                     / \
    -                       -
    |   <<centralwidget>>   |
mainwinow  <>---------->  chart
The chart class overrides paintEvent(), which is called whenever a chart window needs to be repainted or redrawn. This event can be triggered by a window manager whenever the window is raised, or by the program itself in the response to some menu events. Typically, the update() or repaint() functions push QPaintEvent to the message loop. repaint() provides immediate painting.
struct chart:QWidget{
   chart(QWidget *p=0);
   ~chart();
   QString _y1str,_y2str;
   int _step1,_y1min,_y1max,_step2,_y2min,_y2max;
   c_t _ct[COUNT];
   int _cur;
   void init(int y1min, int y1max, int step1, QString y1str,
      int y2min=0, int y2max=0, int step2=0,
      QString y2str="");
   void data(float y1, float y2);
   protected:
      void paintEvent(QPaintEvent*);
   private:
      Q_OBJECT
};
The ‘chart’ class provides two y-axis (left y1axis and right y2axis) and one x-axis (bottom). y1axis and y2axis can be configured separately for min, max, and steps of demarcation. X-axis is always a timestamp representing the data captured time and is formatted in min:sec:milli. Data drawn moves right to left in real time.
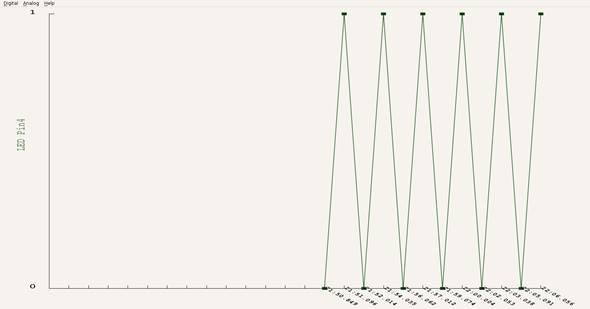
Figure 1: The ‘chart’ class
      <----- data shifting leftwards


      ------------------
      |    -_min1      |-----o init
      |    -_max1      |
      |    -_step1     |
      |    -_str1      |
      |    -_min1      |-----o data
      |    -_max2      |
      |    -_step2     |
      |    -_str2      |
      |    +_ct[COUNT] |
      -----------------
          chart class
The init() function initializes _min1, _max1, _step1, _str1, and, optionally _min2, _max2, _step2, and _str2. _str1 and _str2 are names for Y1 Axis and Y2 Axis.
The data() function adds y1 axis and y2 axis data to the internal list _ct. Adding data calls repaint() so that paintEvent() redraws the chart.
Integrating the Chart with rPI3 Applications
            QMainWindow               QWidget
                / \                      / \
                 -                        -
                 |    <<centralwidget>>   |
 application <-------<> mainwinow <>---------->  chart
     process()           process()

struct mainwindow:QMainWindow{
   mainwindow(QMainWindow *p=0);
   ~mainwindow();
   rpi3 *rpi[SENSORCOUNT];
   int rpin;
   QAction *sensoraction[SENSORCOUNT];
   QAction *grabaction;
   chart *chrt;
   QTimer *timer;
   public slots:
      void process();
      void slotactiontriggered();
   private:
      Q_OBJECT
};
mainwindow is a class that inherits QMainWindow and sets the chart as the centralwidget to it. To integrate an application with the chart, application-specific menus can be added to the mainwindow constructor and, in the menu trigger (callback) code, the chart can be initialized as per the application’s need.
mainwindow::mainwindow(){
   ...
   tmenu=menuBar()->addMenu(tr("&Digital"));
   // Adding led and dht11 applications
   tmenu->addAction((sensoraction[LED]=new
      QAction(tr("LED"),this),sensoraction[LED]));
   tmenu->addAction((sensoraction[DHT11]=new
      QAction(tr("DHT11"),this),sensoraction[DHT11]));
   ...
}
connect(sensoraction[i],SIGNAL(triggered()),this,
   SLOT(slotactiontriggered()));
In the trigger function, the application needs to be instantiated. Then, the chart is initialized with an init() call.
mainwindow::slotactiontriggered(){
   ....
   if ((QObject*)sender()==sensoraction[DHT11]){
      if(!rpi[DHT11]){
         rpi[DHT11]=new dht11(4);
         chrt->init(rpi[DHT11]->_min1,rpi[DHT11]->
            _max1,rpi[DHT11]->_step1,"Celcius",
            rpi[DHT11]->_min2,rpi[DHT11]->_max2,
            rpi[DHT11]->_step2,"Humidity %");
      }else if(rpin!=DHT11)
         chrt->init(rpi[DHT11]->_min1,rpi[DHT11]->
            _max1,rpi[DHT11]->_step1,"Celcius",
            rpi[DHT11]->_min2,rpi[DHT11]->_max2,
            rpi[DHT11]->_step2,"Humidity %");
         rpin=DHT11;
      process();
Application collecting data has to implement a function called process(void*):int which mainwindow::process() calls at regular intervals. A return from application::process as 1 gives hints for adding data to the chart.
void mainwindow::process(){
   // Trace("mainwindow::process")
   int wait=0;
   timer->stop();
   if(rpi[rpin]->process(&wait)){
      chrt->data(rpi[rpin]->_ct.y1,rpi[rpin]->_ct.y2);
      if(!wait)wait=10;
   }else
   if(!wait)wait=100;
      timer->start(wait);
      // Trace("<>mainwindow::process")
}
Application process(void*) function:
int pir::process(void* waitp){
   // Trace("><pir::process")
   static int intruder=!(GPIO_READ(pin));
   int temp=0;
   if(intruder!=(temp=GPIO_READ(pin))){
      intruder=temp;
      if(intruder){
         _ct.y1=1;
         *(int*)waitp=1000;
      }else{
         _ct.y1=0;
         *(int*)waitp=100;
         return 1;
      }
   }
   // Trace("<>pir::process")
   return 0;
}
Tracing and Logging
Chart and application tracing is achieved on the console by default. To disable it, add ‘DEFINES += NODEBUG’. To detach console, add ‘CONFIG -= CONSOLE’.
Compiling and Executing the Program
Download and uncompress the source code. To compile a program, go to the rPI3_265789 directory and execute the following:
pi@rapberrypi:~/rPI3_265789 $ qmake
pi@rapberrypi:~/rPI3_265789 $ make
Execute the binary wit:
pi@rapberrypi:~/rPI3_265789 $ sudo ./rPI3_digital
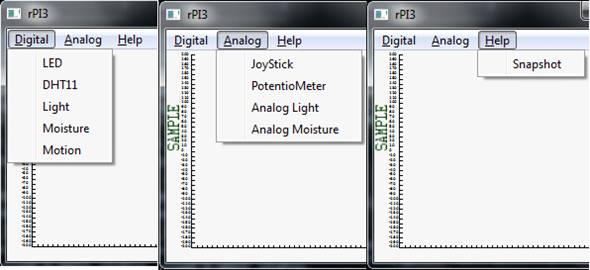
Figure 2: A sample program, running
Summary
This article discussed the Qt 2D display chart class that is implemented as a library and used by applications for drawing real time data. Qt installation to building the source code and then running the binary was also discussed in detail.