

Introduction
Graph data structures like DAGs and Trees are part of every computer science curriculum. Graphs are unique because, they’re not
only code plumbing, they’re often the plumbing we want to visually depict or physically manipulate. If you’re like most .NET
developers you would prefer a library over building something yourself, especially if building a custom feature doesn’t differentiate
your software product. If your software is .NET based you’re in luck. Microsoft Automatic Graph Layout will do the heavy lifting for
you, including intelligently handling all the rendering so the graph layout makes visual sense. Using a sample application I’m going
to introduce you to Microsoft Automatic Graph Layout.
Overview
The sample was built in Microsoft Visual Studio Pro 2008. The control ships with an MSDN license. You can also get the control from the sites at the end of this article. I borrowed a lot of code from the samples shipping with the product.
As I stated earlier Microsoft Automatic Graph Layout is a Windows Forms control for rendering graphs. Therefore, all of the Automatic Graph Layout samples are Windows Forms applications. I really like Windows Presentation Foundation (WPF). I also liked the idea of building something new, rather than rehashing something already covered in the samples. So, I decided to make the sample a WPF Desktop application. As you’ll see later in the article building in WPF required a little twist, but the experience is very similar to Windows Forms. The running sample application is depicted below.
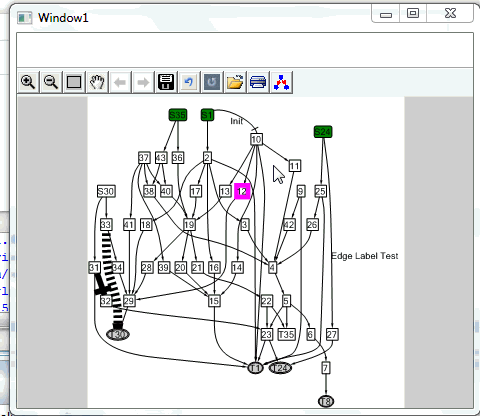
Figure 1: Sample application
The steps to building a graph using Automatic Graph Layout are summarized below.
- First, attach a GraphViewer to the surface you want to render the graph on.
- Create a Graph object.
- Build a graph, from the
NodeandEdgeclasses. - Attach the Graph object to the GraphViewer
Once a graph is assembled and assigned to a viewer, Automatic Graph will intelligently render the graph freeing the developer of the tedious task of assigning a viewing position for each Node and Edge.
For the remainder of the article, I’m going to cover each step in detail, starting with the setting up of the project.
Configuring the Project
Microsoft Automatic Graph Layout install ships in an MSI file. Once installed, you’ll find all the components here:
C:\Program Files (x86)\Microsoft\Microsoft Automatic Graph Layout\bin
As I stated earlier, the sample is a standard Windows presentation Foundation (WPF) Desktop application. Automatic Graph Layout is divided into three components, each housed in a separate assembly.
Microsoft.Msagl.dll, the graphing engineMicrosoft.Msagl.Drawing.dll, the drawing componentMicrosoft.Msagl.GraphViewerGdi, the viewer plug-in.
I referenced each of these in the sample. As I stated earlier, Automatic Graph Layout is a Windows Forms control. I also mentioned that there was a twist required to running a WinForms control inside of a WPF application.
WinForms in Windows Presentation Foundation (WPF)
Before hosting a WinForms control, a developer must add the following reference to the project.
WindowsBase.dllWindowsFormsIntegration.dll
Inside of the XAML file hosting the graph, reference must be made to the GraphViewer control if the control is going to be accessed in code. The reference appears below.
xmlns_gv=”clr-namespace:Microsoft.Msagl.GraphViewerGdi;assembly=Microsoft.Msagl.GraphViewerGDI”
Next, a reference must be made to a class aptly name WindowsFormsHost. The reference must appear inside of the surface you wish to draw on. Here is the WindowsFormsHost reference in the sample.
<WindowsFormsHost Name=”windowsFormsHost1″ Margin=”0,34,0,0″>
    <gv:GViewer x_Name=”gViewer”></gv:GViewer>
</WindowsFormsHost>
Now that all the infrastructure is in place, I’ll explain how to build the graph.
Building a Graph
Among graph data structure resources, you’ll find some variation in terminology. In Automatic Graph Layout, Nodes are the components in the Graph and an Edge is a line connecting two Nodes. Automatic Graph Layout has a default “look”, but also allows for a great deal of visual customization. I’ll discuss customization later in the article.
Before building a graph, a developer must allocate a Graph object. Here is the Graph class allocation in the sample.
Graph graph = new Graph(“graph”);
The easiest way to build a graph is to create the edges of the graph like in the example below.
graph.AddEdge(“S35”, “36”);
graph.AddEdge(“S35”, “43”);
graph.AddEdge(“S30”, “31”);
graph.AddEdge(“S30”, “33”);
graph.AddEdge(“9”, “42”);
As you can see, when you create edges this way, Graph objects are allocated, given default attributes, and assigned the identifier passed into the AddEdge method. Once the Graph is built the only step left is to assign the Graph to a viewer, like it the code below.
//layout the graph and draw it
this.gViewer.Graph = graph;
If I had stopped building my sample here, I would’ve had a graph with a set of Nodes, all with the default “look”. Most likely a developer will want to customize the Graph “look”. As I stated earlier, there are ways to customize Nodes and Edges.
Customizing Nodes and Edges
Customizing Nodes and Edges uses much of the same terminology and attributes you’be come to expect in Windows Forms and WPF development. Here is the customization code from the sample.
private static void CreateSourceNode(Node a)
{
    a.Attr.Shape = Microsoft.Msagl.Drawing.Shape.Box;
    a.Attr.XRadius = 3;
    a.Attr.YRadius = 3;
    a.Attr.FillColor = Microsoft.Msagl.Drawing.Color.Green;
    a.Attr.LineWidth = 10;
    a.UserData = “UserData present”;
}
You may have noticed the UserData property on the Node class. UserData is an object class property. UserData allows a developer to store some linkage from a Node or Edge into some other part of the application. UserData property can be leveraged for a richer visual interaction experience.
Interaction
In the sample, I leveraged UserData for some simple behavior. When a user selects a Node or Edge with UserData attached, the UserData information is displayed in the label above the graph. To get this working I wired up a SelectionChanged delegate. The code appears below:
gViewer.SelectionChanged +=
new EventHandler(gViewer_SelectionChanged);
An excerpt from the SelectionChanged delegate appears below.
void gViewer_SelectionChanged(object sender, EventArgs e)
{
    if (selectedObject != null)
    {
        if (selectedObject is Edge)
            (selectedObject as Edge).Attr = selectedObjectAttr as EdgeAttr;
        else if (selectedObject is Node)
            (selectedObject as Node).Attr = selectedObjectAttr as NodeAttr;
        selectedObject = null;
    }
There are a rich set of delegates to capture many other user-interface changes and actions.
Earlier in the article I displayed the application. You may have noticed a toolbar at the top of the application. The toolbar allows various other operations like zooming and printing the graph. By default the toolbar is on, but it can be disabled if desired.
Conclusion
Graph data structures are a common part of many applications. Graphs are unique, because an application utilizing a graph data structure must not only store the graph internally, it often times must render some aspect of the data structure visually. Microsoft Visual Graph Layout is a Windows Forms Control for rendering a graph.