

Introduction
Here’s a situation the ASP.NET developer is undoubtedly
familiar with. The end user says your web application
doesn’t work and gives an error, possibly the infamous
Yellow Screen of Death (Figure 1). But on your development
environment, you cannot reproduce the problem. Since you
have also disabled detailed error messages on the production
server (usually a good practice), the error messages won’t
give you much information. This is especially the case if
you’ve replaced the regular ASP.NET error messages with your
own.
[error.jpg]
Figure 1. An ASP.NET error page, or the “Yellow Screen of Death”
Of course, in case of an application failure, it would be
beneficial to have some kind of logging in place in your
application. Some applications write log entries to text
files, databases, and so forth. But these logging
capabilities are usually only added after the fact, and then
it is already too late. Without ready-made logging in place
and with only the web server to help you, what can you do?
Let Microsoft IIS 7 give a
helping hand.
Learning to Let IIS Give a Helping Hand
Since the earliest versions of IIS (Internet Information
Server), the web server has created logs in text-based
files. These files can be configured to contain lots of
useful information, and can be analyzed with many third-
party utilities. But even so, they are quite basic in nature
(Figure 2), and only display the result of a request: was it
a success or a failure?
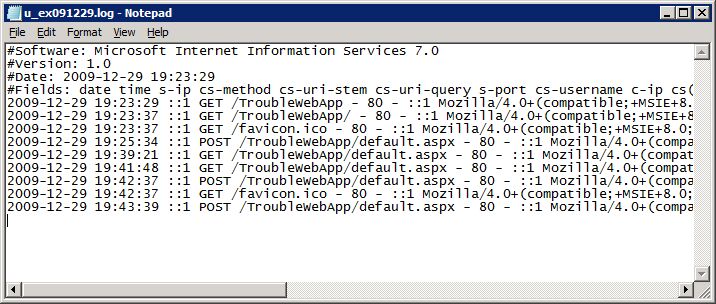
Figure 2. A basic text-based log file created by IIS
Of course, if you want to know how often your
application(s) fail, then this information can already be
useful. By knowing that a certain request URL always causes
a 500 Internal Server Error to occur can lead you to the
right track and location in code. Thus, if you have nothing
else, make sure you start from these log files.
Even though the log files can be useful, they usually are
not detailed enough. When the problems with the applications
get tougher, you will need better troubleshooting tools.
Fortunately, if you are using IIS version 7 or later
(version 7.5 is the latest one at this writing), then you
have additional methods available. The trick is to learn how
to use them. Note that IIS 7 was introduced with Windows
Vista in 2006; it is also available on Windows Server 2008,
Windows 7 and Windows Server 2008 R2. Alas, you cannot
retrofit IIS 7 to older Windows versions, say Windows Server
2003.
IIS 7 contains a new feature called Failed Request
Tracing, or FRT for short (Microsoft internally calls the
feature as FREB or Failed Request Event Buffering for
historical reasons). Failed Request Tracing is an advanced
feature that allows you to focus on just what you are after:
failed requests. FRT is also versatile; you can set multiple
tracing options, and only monitor certain web application
types or requests reporting back only certain HTTP status
codes. You can also limit monitoring to certain .aspx files.
FRT can make a big difference: troubleshooting can take 15
minutes instead of three hours, so with it, there are
chances to get home on time.
The following list shows some basic features which you
utilize when working with Failed Request Tracing. The list
is by no means comprehensive; so flexible is the feature in
question.
- Monitor requests to any file type you specify, including
.asp, .aspx and .php. - Check full request and response HTTP headers to make
sure all required data is available. - Calculate how many bytes were sent back and forth, and
how long it took to process the request in each pipeline
step. - Filter on requests that take over N seconds to
process. - Filter on certain HTTP response codes, such as 403, 404
or 500. - Filter on filenames with wildcards, such as
“login*.aspx”. - Know which HTTP modules were used to handle the
request. - See how routing and URL rewriting affect request
processing. - Monitor which application pools were used to handle the
request. - See how load balancing (if enabled) is working and which
server is responding to the request. - Select the appropriate providers for tracing events,
such as web server caching, compression, ASP.NET
infrastructure, and so on.
Even though the name of the feature starts with the word
“Failed”, you can in fact use FRT to monitor completely
valid requests to the web server as well. This way, you can
for instance check to see that all HTTP headers are in place
and that serving the requests doesn’t take too long. In this
article, the focus is on monitoring ASP.NET web
applications, but as you have already gathered from the
above, the feature is useful to investigate with any web
application type, including classic ASP, PHP and others.
Installing and Enabling Tracing
To get started with Failed Request Tracing in IIS 7, you
must first enable the feature. The following steps are taken
from Windows Server 2008, but the instructions would be
similar for Windows Vista, Windows 7 and Windows Server 2008
R2.
First, you need to make sure the FRT feature is installed
with IIS. By default, IIS 7 only installs those features
that are absolutely necessary to prevent security attacks to
the server. This means that FRT is also missing by default,
so you need to separately install it to be able to use
it.
Windows Servers have lately been using the words “role”,
“feature” and “role services” to describe functionality.
Within this terminology, FRT is a role service of the web
server role. To install it, start the Server Manager
(usually at the top of the Start menu), go to the web server
role (available at the tree view on the left), and then
choose the “Add Role Services” link from the right (Figure
3).
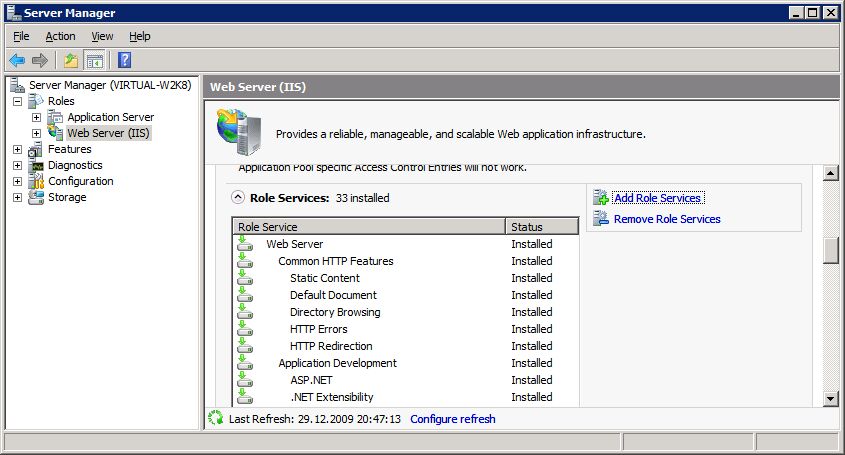
Figure 3. To add support for tracing into IIS 7, you must add the tracing role service
At this point, a new dialog box opens showing a list of
available services for the web server. Under the Health and
Monitoring node, make sure Tracing is checked, and then
proceed with the Next and Install buttons. After the tracing
service has been installed, you should see a message saying
“Installation succeeded”. Click Close to dismiss the dialog
box.
Once you have completed the installation, you can find
the Failed Request Tracing Rules icon in the management
console (Figure 4). To be able to use FRT, you must enable
it for each web site you want to monitor. This is done from
the IIS Manager (also available as part of Server Manager)
by choosing the site from the left-hand side, and then
navigating to the Failed Request Tracing Rules icon.
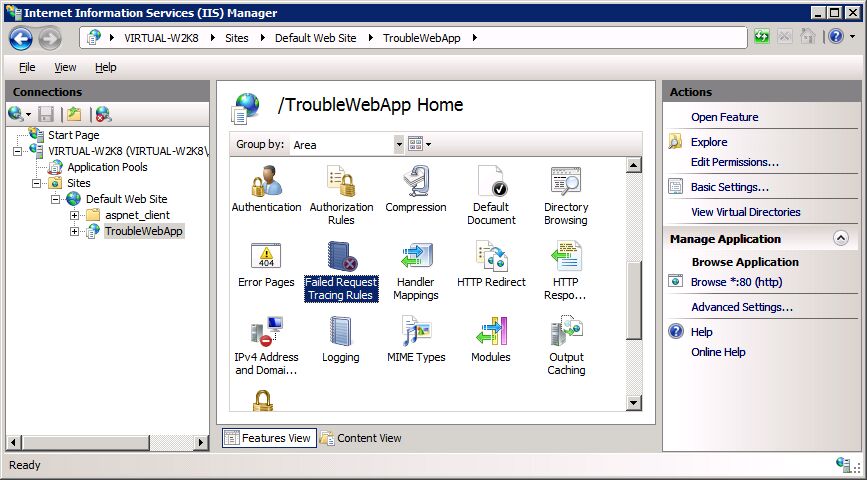
Figure 4. The FRT icon becomes visible in the management console after installation
Under Actions on the right, click the link “Edit Site
Tracing” (Figure 5). This will open a dialog box where you
must check the Enable check box, and select the folder to
which you want to store the log files. You can also specify
how many log files can be created before the older ones
start to be deleted.
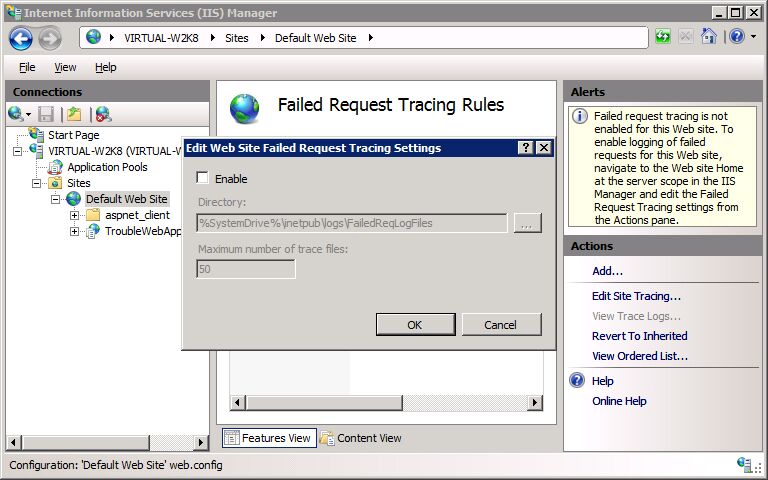
Figure 5. Tracing must be enabled for each site whose requests you want to monitor
Even though you need to specifically enable FRT for each
site, it doesn’t mean that every request coming to the site
is traced (unless that is what you want to do). Instead, you
can configure the feature on different scopes: site-wide,
application-wide, and so on. This is important from a
maintenance perspective, but also from a performance
perspective.
Performance is a consideration because enabling FRT will
affect IIS’s request processing speed. Therefore, you should
only enable the feature when necessary, and then within the
appropriate scope. But even if you would enable FRT on a
very busy site, the feature will auto-tune itself if there
are too many requests in a short period of time. Thus, even
gross mistakes in configuring the feature should not bring
the web server to a grinding halt.