

Introduction
In my last article we covered many of the basics for using and configuring the
Microsoft Chart Control for the .NET Framework 3.5. Similar to the
previous article, we will primarily focus on ASP.NET functionality of the Chart
Control. For this ASP.NET tutorial we will dive into the AJAX capabilities of the
Chart control including real-time data and interactivity.
For many applications real-time data is a requirement and as such it tends to be very complicated. Especially when it comes to real-time charting. The Microsoft Chart Control actually makes the process of real-time charting very easy. To begin with real-time data/charting we first need to create a new AJAX enabled Web application. Within the default.aspx page, we need to add the ScriptManager control as well as an UpdatePanel. Within the UpdatePanel we need to first add an AJAX Timer as well as the Chart control itself as shown below.
|
|
If you are not familar with the purpose of the AJAX Timer you may be wondering
|
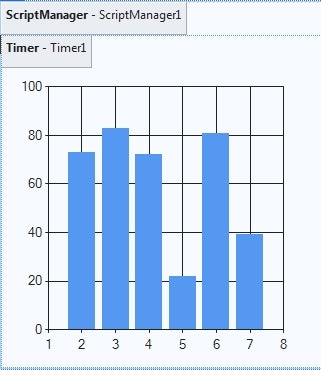
Out of the box, the Chart control is setup for a single Chart Area with a single
series and for real-time data that is sufficient for what we need.
However, when I think of real-time data with regard to a chart it is usually a
strip chart or spline chart such as those used for stocks or monitoring value
changes over time. Edit the Series using the Series property on the Chart.
Switch the Type from Column to Spline which will provide a smooth line
representing the data.
Next, we will make the changes necessary to the Timer. In the Timer
properties, set the Interval to 1000 which will cause the Timer to fire the Tick
event once every 1000ms or 1 second. Next create the handler for the Timer
Tick event with the following code block:
protected void Timer1_Tick(object sender, EventArgs e)
{
   Series s = Chart1.Series[“Series1”];
   //Determine the next X value
   double nextX = 1;
   if (s.Points.Count > 0)
   {
      nextX = s.Points[s.Points.Count-1].XValue+1;
   }
   //Add a new value to the Series
   Random rnd = new Random();
   s.Points.AddXY(nextX,(rnd.NextDouble() * 10)-5);
   //Remove Points on the left side after 100
   while (s.Points.Count > 100)
   {
      s.Points.RemoveAt(0);
   }
   //Set the Minimum and Maximum values for the X Axis on the Chart
   double min = s.Points[0].XValue;
   Chart1.ChartAreas[0].AxisX.Minimum = min;
   Chart1.ChartAreas[0].AxisX.Maximum = min + 100;
}
At a high–this code performs the following functions:
- Grabs a reference to Series1
- Determines the next value to use for the X value, either 1 or the previous value
+1 - Adds a point to the Series using the X value determined previously and a Random
Value for Y. The math for the Random Value is designed to provide a random
number between -5 and +5. - If the points within the Series are greather than 100 remove the points starting
at position 0. The purpose for this code is to limit the number of points
within the series and remove from the left side as needed. The effect of
this is to provide a chart which appears to scroll to the left with the most up
to date values on the right. - Finally, set the minimum and maximum values for the X Axis on the Chart.
The overall effect of this code is to add one random value to the right side of
the chart and provide the effect of scrolling to the left. At this point,
if you were to run the project you will notice that the Chart doesn’t actually
display the data correctly. The reason for this is that the Chart is only
storing the most recent value added to the Series. While you can either
populate the entire series with data as you would do with data binding to a
database. In our case we are incrementally populating the Series one value
at a time. The simple solution is to enable ViewState on the Chart
control. Yes by default, the Chart control does not have ViewState
enabled.
After enabling ViewState and running the project, allow it to run for a bit and you
should see an image similar to Figure 2 below.
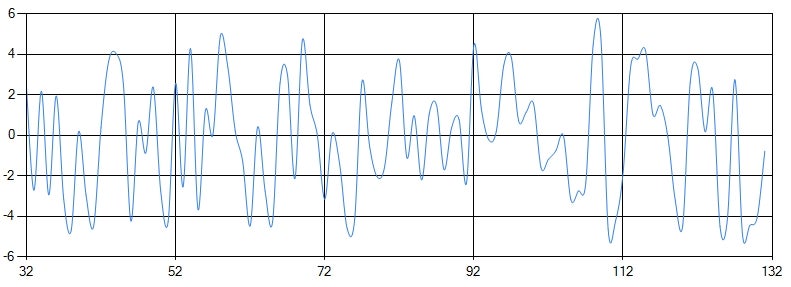
Figure 2 – Sample Run