Introduction
Performance of any application is top priority from a customer perspective. For a developer, identifying performance issues prior to production deployment is a difficult task indeed. Visual Studio 2015 Diagnostic Tools made it easier for developers to have a performance analysis and review before the application goes live. As a Visual Studio 2015 developer, you can get detailed application insights while you are debugging code.
How to Enable Visual Studio Diagnostic Tools
By default, the Diagnostic Tools window opens automatically while debugging. You can enable it manually by selecting Visual Studio Options from the menu (Tools -> Options). From Options, choose Debugging -> General and check the ‘Enable Diagnostic Tools while debugging’ checkbox.
Figure 1: Enable Diagnostic Tools
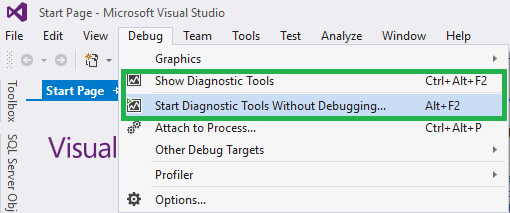
After enabling it from Visual Studio 2015, the new Diagnostic Tools window will appear. From the Debug menu, you can view ‘Show Diagnostic Tools’ (see Figure 2).
Figure 2: Run Diagnostic Tools from the Debug Menu
What Visual Studio Diagnostic Tools Are
Following are the components of the Visual Studio Diagnostic tools that are available in VS 2015:
- Output Window: Allows you to see program output and other debugger events while it is running.
- IntelliTrace: Use IntelliTrace to record historical debugging information when the application is running. IntelliTrace records your application execution, looking for interesting events. A developer can control the IntelliTrace events from Tools -> Options -> IntelliTrace -> IntelliTrace Events.
- Performance and Diagnostics hub: A developer has choices of performance tools, such as the CPU Usage tool and the Memory Usage tool. The Memory Usage tool is designed to work with processes without a debugger attached; this allows you to perform a comprehensive performance analysis of your app as it runs without the debugger.
Following are the benefits of Diagnostic tools:
- The ability to monitor performance while debugging
- Correlate performance data with debugging activity
- Richer user experience through IntelliTrace and the Output windows
- Shortening diagnose time to identify and fix an issue
Diagnostic Tools Window
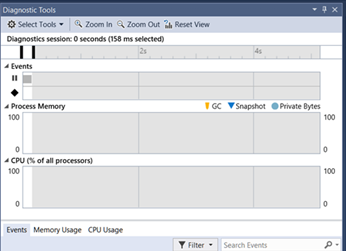
In the Visual Studio 2015 Diagnostics window, you will find three tools named Events, Memory Usage, and CPU Usage. You can enable or disable the CPU and Memory tools by checking or unchecking them from the ‘Select Tools’ drop-down (see Figure 3).
Figure 3: Diagnostic Tool Selection Drop-down
These Diagnostic Tools represent information in two complementary ways:
- They add graphs to the timeline in the upper half of the window
- They provide detailed information in the tabs on the bottom
Figure 4: Diagnostic Tool Graph and Tab View
Debugger Events: These provide you with access to all Break, Output, and IntelliTrace events during your debugging. The data is presented both as a timeline and as a tabular view. Messages that are sent to the Debug tab of the Output window are captured by IntelliTrace.
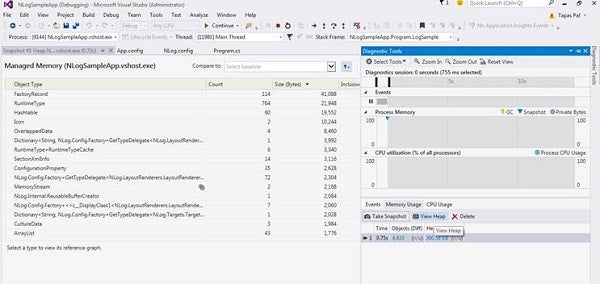
The Memory Usage tool: It helps a developer monitor the memory usage of the application during debugging. A developer can analyze memory impact, growth, and leak issues simply by looking at the graphs. Code break events allow you to identify the parts of the graph that are related to recent debugging activity. You also can take snapshots before and after debug actions to analyze memory usage and memory growth.
Figure 5: Memory Usage Diagnostic Tool
The CPU Usage tool:Track your application’s CPU usage while you are debugging. A developer can get a per-function breakdown of CPU usage. To do this go, to Debug -> Start Diagnostic Tools without Debugging, select CPU Usage, and click Start.
Debugging Code and Diagnostic Tools Window
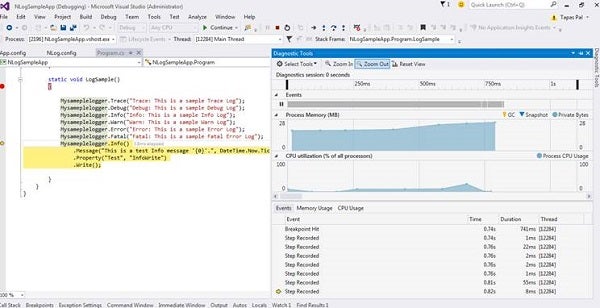
During code debugging, breakpoints hits, stepping through code, clicking the break all (pause) button, breaking exceptions, and Debugger.Break() statements in code are diagnosed by the tools and display information in the timeline. The rectangles indicate the amount of time the application was running and colored lines hovering over the rectangles indicate whether the application was paused (combination of different color codes), as shown in Figure 6. Following are the different color code definitions:
- Red: Application was paused due to a breakpoint hit
- Yellow: Paused for a step running to completion
- Blue: To break all
Figure 6: Diagnostic Tool Graph During Break Point Hit
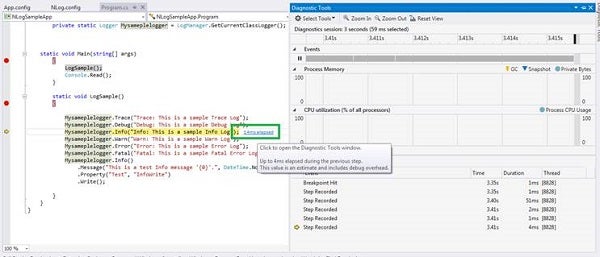
The elapsed time shown in Figure 7 can be found by hovering over the events in the Debugger break event track, and in the duration column for break events in the Debugger events details tab.
Figure 7: Diagnostic Tool Elapsed Time
You can change the selection of an event at any time by clicking one of the debug break actions to snap the selected range of time to that event (see Figure 8).
Figure 8: Events Elapsed Time
Or, you also can change by clicking and dragging the graphs or the ruler to select a more specific range of time (see Figures 9 and 10).
Figure 9: Events Dragging, part 1
Figure 10: Events Dragging, part 2
Conclusion
In this article, I have covered a very useful feature of Visual Studio 2015, called Diagnostic Tools. I hope the information will help developers to debug application code and to monitor CPU and memory usage.
References
For more details, refer to the following useful URLs:


