

Introduction
Since the advent of computing, production mode application failures have caused many developers to grimace in pain because of the lack of ability to debug on a production server which could amount to huge monetary impact on business operations). Since these developers don’t have access to the live process, they ask for the next best thing – a memory dump.
On the other hand, application crashes produce Watson dumps which can also be used to examine the state of the process at the time of the process and can be used to find the root cause of the failure.
What Are Dumps?
So, what are these dumps you talk about? A dump is defined as a representation of a working application at a particular state in time. What that means is that a dump is a snapshot of the application. Dumps are of three major types:
- Mini Dump – The dumps generated by Watson in its default mode are minidumps. These dumps contain loaded modules, call stack information. The
windbgcommand to generate minidumps is".dump /m <dumpfile>". - Heap Dump – In addition to loaded modules, these also contain heap memory. The
windbgcommand to generate heap dumps is".dump /mw <dumpfile>". - Full Dump – These contain all the information about the process. The windbg command to generate full-dumps is
".dump /ma <dumpfile>".
Debugging Story for Managed Dumps in Microsoft Visual Studio 2008
In Microsoft Visual Studio 2008, because of the lack of API support in .NET framework 3.5, there was only native dump debugging. If you wanted to do managed dump debugging, you would load the dump in windbg and load the sos.dll extension or the sosex.dll extension (SOSEX v2 Now available here).
Change in Debugging Interfaces in .NET Framework 4.0
The CLR folks over at the .NET framework team added support to debug dumps in the ICorDebug api. Details of the API changes are mentioned at the blog post titled, ICorDebug re-architecture in CLR 4.0. These changes mean that we no longer have to do native style debugging (windbg/sos) of a .NET framework 4.0 dump; rather, we can use VS 2010 or mdbg (the sample managed debugger which ships with .NET Framework 4.0 SDK) to do managed dump debugging.
How Do I Get Dumps of Managed Applications?
There are multiple ways you get dumps of managed applications.
- You can get dumps from Watson via application crashes handled by Windows Error Reporting.
- You can use Windows Task Manager and right click on a process and create a dump. One caveat though, dumps of 32 bit managed processes cannot be properly generated using this method on 64 bit machines.

Figure 1 - You can use Microsoft Visual Studio to snap a dump by attaching to a process and selecting “Save Dump as” option under Debug menu.
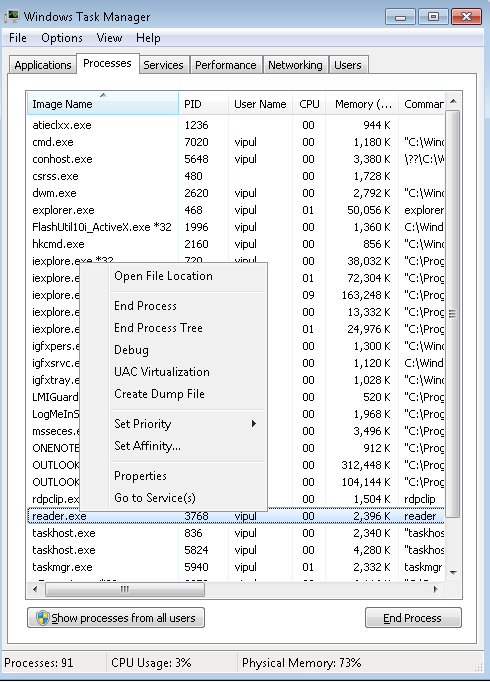
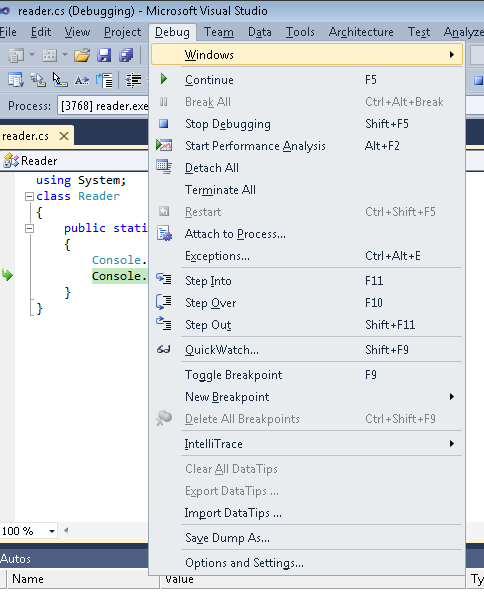
Figure 2
Exercise: Managed Dump debugging
Now that we have our dumps, let us go through an exercise of debugging dumps using managed debuggers like mdbg and Microsoft Visual Studio 2010. Let us write a small application and then create a dump for debugging purposes.
  //reader.cs
  using System;
  class Reader
  {
  	public static void Main()
  	{
  		Console.WriteLine("Take a dump now");
  		Console.ReadLine();
  	}
  }
Compile the above file reader.cs in the debug mode to generate symbols to facilitate debugging.
C:\windows\microsoft.net\framework\v4.0.30319\csc /debug+ /optimize- reader.cs
Now execute reader.exe and snap a dump using either using Windows explorer or Microsoft Visual Studio 2010.