

by Robert Walling
Why Tracing
A standard debugging tactic when developing Active Server Pages (ASP) is to use Response.Write statements to display troubleshooting information to the screen. With the release of Visual Studio .NET and its accompanying step-through debugger this practice has (thankfully) become obsolete in ASP.NET. However, once an application is deployed to a web server the debugger cannot be used without installing Remote Debugging, a practice frowned upon by system administrators due to security issues. One way to bridge this gap is to use a built-in .NET tool called Tracing.
Tracing Explained
Tracing records diagnostic information about a particular web page. Depending on which method is used to activate it (see below) information can be appended to the page display or can be viewed via a separate document URI. Some of the information recorded includes the execution time of page methods, time spent rendering page controls, and the contents of various collections such as the querystring, HTTP header, and session state.
Enabling Tracing
Tracing can be enabled for an individual page or an entire application.
Page-Level Activation
Page-level activation is handy because it allows you to quickly view the trace for a single page without disturbing the rest of the application. You can activate tracing using a page directive:
<%@ Page Language="vb" AutoEventWireup="false" Trace="true"
Codebehind="TraceTest1.aspx.vb" Inherits="Example.TraceTest1"%>
Or in the code-behind using the Trace object:
Private Sub Page_Load(ByVal sender As Object, ByVal e As EventArgs) _
Handles MyBase.Load
Trace.IsEnabled = True
End Sub
Again using the Trace object, a common way to enable tracing dynamically is as follows:
Private Sub Page_Load(ByVal sender As Object, ByVal e As EventArgs) _
Handles MyBase.Load
If Request.QueryString("trace") = "true" Then
Trace.IsEnabled = True
End If
End Sub
This allows tracing to be enabled at any time by calling the page with a querystring flag:
TraceTest1.aspx?trace=true
Application-Level Activation
All three of the approaches above append the trace information to the page display, which is useful for quick debugging or performance evaluation of pages. A drawback to these approaches is that you must add one of them to every page in your website. You can get around this limitation by enabling tracing for an entire application. There are two ways to accomplish this.
The first is to modify the trace element in web.config as follows:
<trace enabled="true" pageOutput="true" requestLimit="10" traceMode="SortByTime" localOnly="true" />
enabled turns tracing on or off
pageOutput determines whether or not trace information is output to the page. If pageOutput is set to false trace information can be retrieved via web browser by visiting http://applicationRoot/trace.axd. Trace information is not physically stored in an .axd file. Instead, .NET intercepts the request for this URI and outputs the trace information to the browser.
requestLimit is the number of page requests that are stored and displayed via trace.axd if page output is set to false.
traceMode can be SortByTime or SortByCategory, and defines the way the trace results are displayed.
localOnly defines whether or not trace information captured by this application level trace will only be displayed to web requests originating from the machine serving the web application. Note that tracing enabled using a page directive or via the Trace object in code are shown to all requests, local or not.
The second way to enable tracing for an application is to insert the following into your global.asax.vb file in the Application_BeginRequest method:
' ENABLE TRACING ON PAGE IF SPECIFIED

If (Context.Request.QueryString("trace") = "true") Then
Context.Trace.IsEnabled = True
End If
Then place ‘trace=true’ into the querystring of any page to enable tracing:
TraceTest1.aspx?trace=true
This is handy during development but remember to remove it before moving to production. With this approach, anyone who inserts ‘trace=true’ will see the trace information.
Trace Contents
The trace can contains up to 10 sections, many of which only appear if they contain data. The sections are: Request Details, Trace Information, Control Tree, Session State, Application State, Cookies Collection, Headers Collection, Form Collection, QueryString Collection, and Server Variables.
The Request Details section contains some basic information including the user’s session ID, the time the request was made, and a status code.
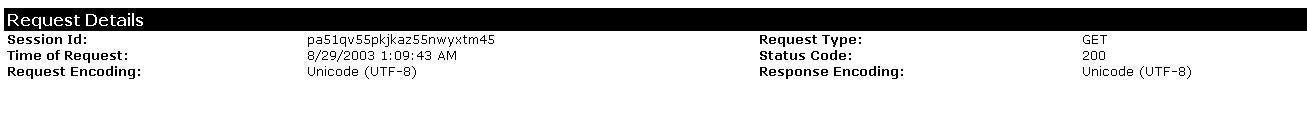
Figure 1: Request Details Section
The Trace Information section contains the execution time of each built-in page method.
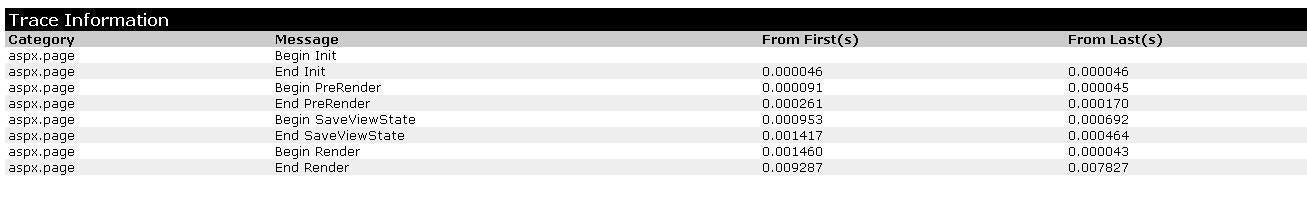
Figure 2: Trace Information Section
The Control Tree section contains each control rendered to the page. Information includes relevant nesting of controls, the type of control, the size (in bytes) of the rendered control, and the size the control occupied in the viewstate. This information can be handy for troubleshooting long page-loads.
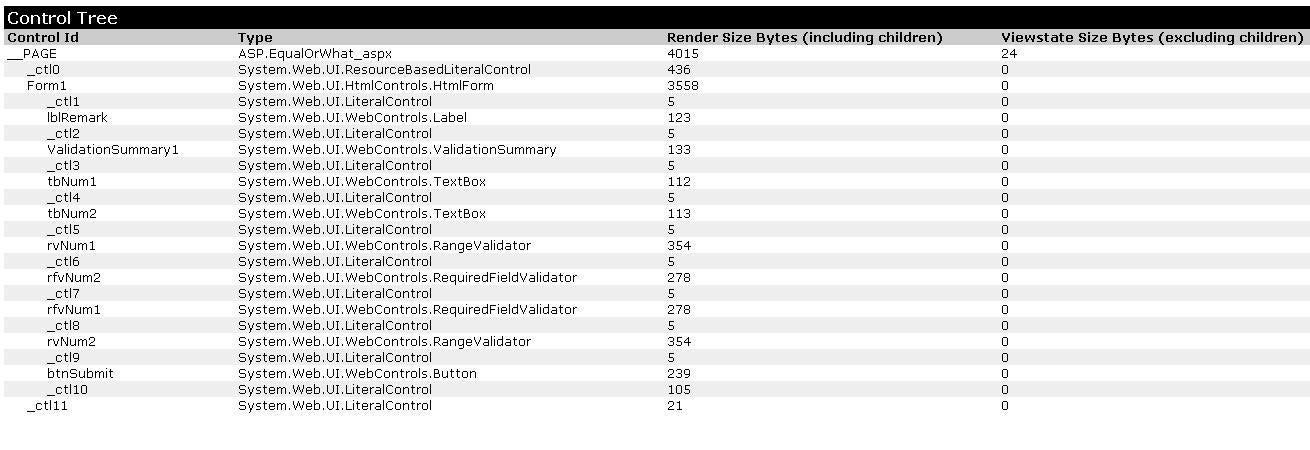
Figure 3: Control Tree Section
The Session and Application State sections appear next if they contain data. Name and value pairs are listed.
The Cookies Collection section enumerates the names and values of all cookies.

Figure 4: Cookies Collection Section
The Headers Collection section contains the name and value for each item in the http header.
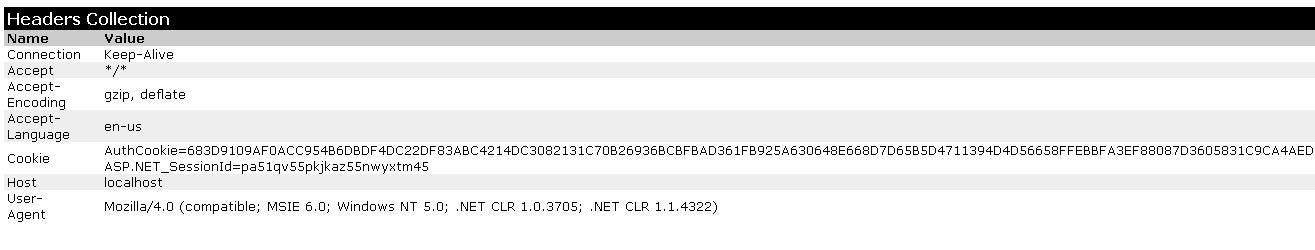
Figure 5: Headers Collection Section
The Form and QueryString collection sections appear next if they contain data.
The Server Variables section contains the contents of the Request.ServerVariables collection.
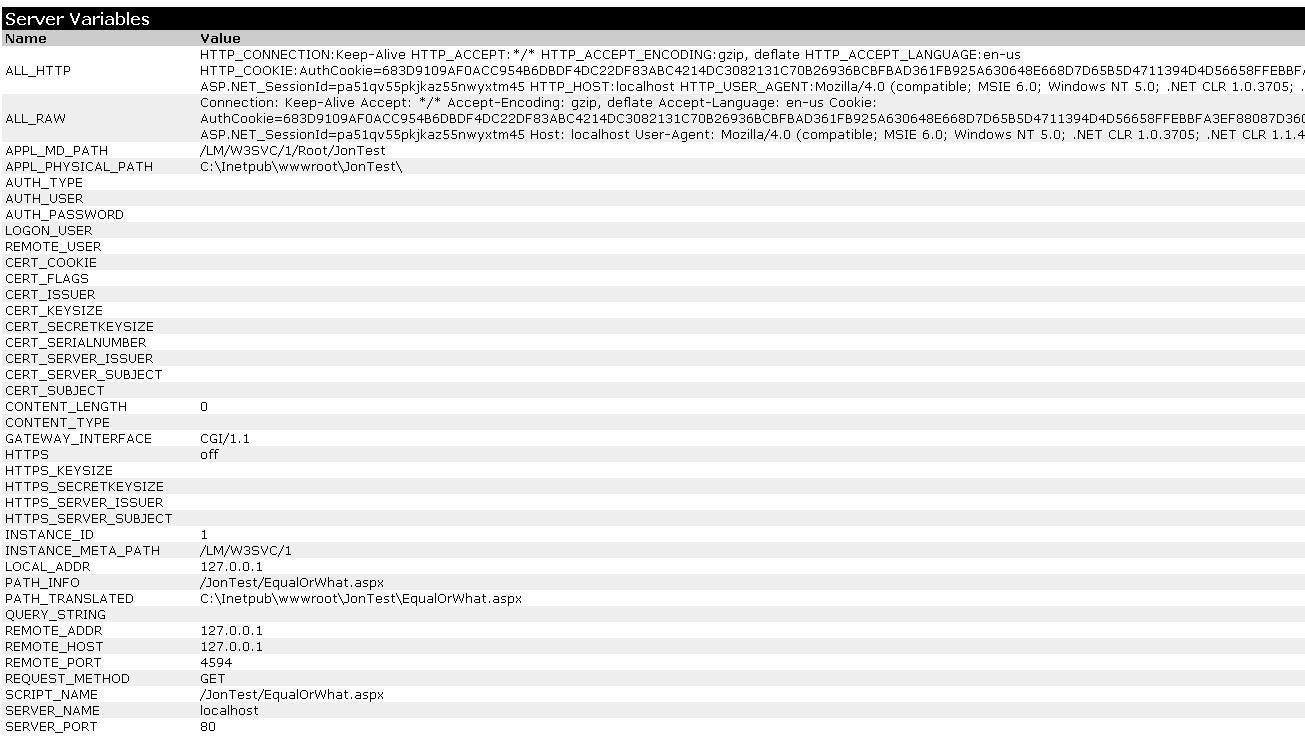
Figure 6: Server Variables Section
Writing to the Trace
The final feature of Tracing is the ability to write custom messages to the output. These messages appear in the Trace Information section and are written using the Trace object:
Private Sub Page_Load(ByVal sender As Object, ByVal e As EventArgs) _
Handles MyBase.Load
Trace.IsEnabled = True
Trace.Write("Before retrieving an item from ViewState")
Dim a As Object = ViewState("Test")
Trace.Write("After retrieving an item from ViewState")
End Sub
The result is shown below:
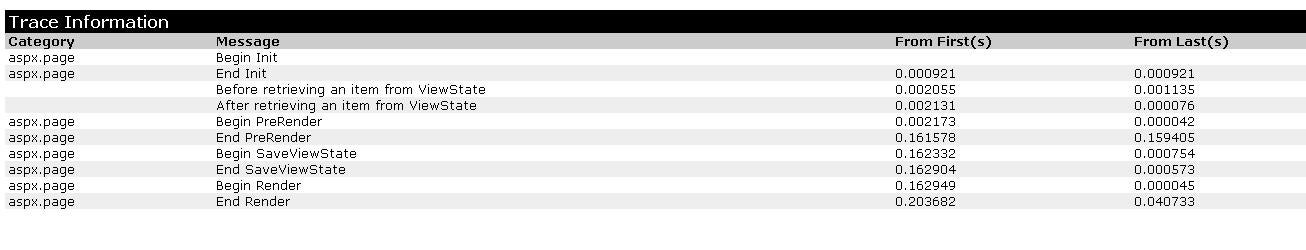
Figure 7: Trace.Write Sample
Another way to output to the trace is using Trace.Warn. Trace.Warn is identical to Trace.Write except the text displayed is red instead of black.
Text written using the trace object is only output if tracing is enabled, so this is an easy way to insert debugging messages into your code that will not output once the application is migrated to production (assuming you de-activate tracing during the migration). Outputting custom trace messages is a good way to determine how long it takes to perform a specific action and can aid in streamlining page execution.
Conclusion
Tracing is a great way to get information about your ASP.NET pages without a lot of hassle. It’s one more tool to add to your utility belt when troubleshooting production web applications.
About the Author
Rob Walling is an MCP and has worked as a software developer for the past four years. His areas of expertise include ASP.NET, VB.NET, and web-based application design. Rob is the principal of the Los Angeles-based consulting firm The Numa Group.