

Introduction
While debugging an ASP.NET Web API you may need to figure out how your code is being executed and you may also want to track its execution sequence. That is where tracing comes into the picture. Using tracing you can trace the flow of execution and various events happening in the Web API. You can either use the default trace writer provided with the Web API or create your own. This article shows how both of these approaches can be used.
Enabling Default Tracing
ASP.NET Web API provides an easy inbuilt way to enable tracing. Once enabled you can see some of the informative messages emitted by the Web API framework itself; you can also emit your own messages. To learn how this works, begin by creating a new Web API project in Visual Studio. Expand the App_Start folder and open the WebApiConfig.cs file.
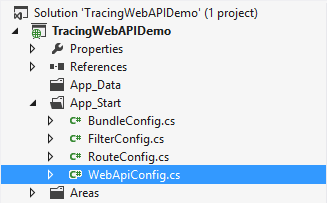
WebApiConfig.cs
This file contains the Register() method as shown below:
public static void Register(HttpConfiguration config)
{
   ...
   config.EnableSystemDiagnosticsTracing();
}
At the bottom of the Register() method you will find a call to the EnableSystemDiagnosticsTracing() method. This method uses System.Diagnostics.Tracing classes to emit trace messages. Make sure that this call is not commented.
Next, go to the Get() method and add the following code in it:
...
using System.Web.Http.Tracing;
using System.Diagnostics.Tracing;

namespace TracingWebAPIDemo.Controllers
{
    public class ValuesController : ApiController
    {
        public IEnumerable<string> Get()
        {
            SystemDiagnosticsTraceWriter traceWriter = Configuration.Services.GetTraceWriter();
            traceWriter.Trace(Request,"My Category",TraceLevel.Info,"{0}","This is a test trace message.");

            return new string[] { "Blue", "Red", "Green" };
        }
    }
}
As you can see from the code, the Get() method calls the GetTraceWriter() method to retrieve the current trace writer object. In this case it will return an object of type System.Web.Http.Tracing.SystemDiagnosticsTraceWriter. You then call the Trace() method on the traceWriter object and pass the Request object, a developer defined category name, TraceLevel from the TraceLevel enumeration and a trace message as the parameters.
If you run the Web API in Visual Studio you will find a series of trace messages being outputted in the Output window.
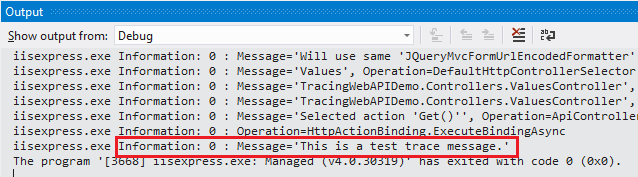
Trace Message Output Window
Notice that there are a few other trace messages emitted by the Web API framework and then there is also a message emitted by your code.
Creating Your Own Trace Writer
Instead of using the SystemDiagnosticsTraceWriter class as the trace writer you can also create your own trace writer. To do so you need to create a class that implements the ITraceWriter interface and then implement its Trace() method. The following code shows how this is done:
public class MyTraceWriter:ITraceWriter
{
  public void Trace(System.Net.Http.HttpRequestMessage request, string category, TraceLevel level, Action<TraceRecord> traceAction)
  {
    TraceRecord record = new TraceRecord(request, category, level);
    traceAction(record);
    string path = HttpContext.Current.Server.MapPath("~/Logs/MyTestLog.txt");
    File.AppendAllText(path, record.Status + " - " + record.Message + "\r\n");
  }
}
The above code shows MyTraceWriter class implementing the ITraceWriter interface. The Trace() method creates an instance of TraceRecord class. The TraceRecord class represents a single trace record and has properties such as Request, Category, Level and Message. The traceAction delegate fills the other properties of the TraceRecord. The above implementation of ITraceWriter writes the trace messages in a text file located in the Logs folder of the application. To get the path of the file you use Server.MapPath() . The AppendAllText() method accepts the path of the file to write and the content that is to be written. Make sure to create the Logs folder before you run the application. If the file with the specified name doesn’t exist it will be created.
This completes your custom trace writer.
Using Your Own Trace Writer
In order to use MyTraceWriter in the application you first need to replace the current tracing service with the newly created one. This is done inside the WebApiConfig.cs file as shown below:
public static void Register(HttpConfiguration config)
{
   ...
   config.Services.Replace(typeof(ITraceWriter), new MyTraceWriter());
}
As you can see the Register() method calls the Replace() method to replace the default trace writer service with an instance of MyTraceWriter. Make sure to comment out the the call to config.EnableSystemDiagnosticsTracing() that you used earlier.
That’s it! you can now emit trace messages from Web API methods such as Get() and Post() as illustrated earlier. This time the trace will be written to the MyTestLog.txt file instead of Output window.
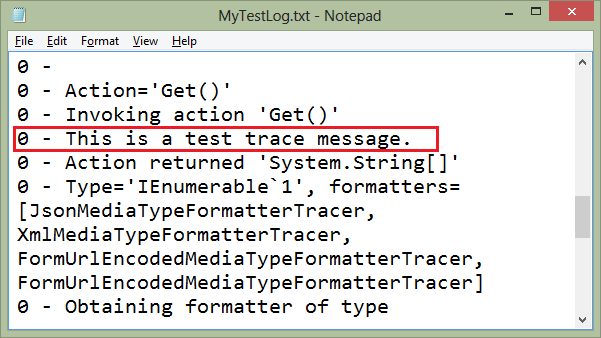
MyTestLog.txt File
As you can see from the above figure all the trace messages are now being written to MyTestLog.txt file.
Summary
You can enable tracing in an ASP.NET Web API using the EnableSystemDiagnosticsTracing() method. This technique uses the System.Web.Http.Tracing.SystemDiagnosticsTraceWriter class to write trace messages. The trace is written to the Output window. You can create a custom trace writer by creating a class that implements ITraceWriter. The newly created trace writer needs to be registered with the system using Replace() method.