

Most texts that describe Windows NT system calls keep many of the important details in the dark. This leads to confusion when trying to understand exactly what is going on when a user-mode application “calls into” kernel mode. The following article will shed light on the exact mechanism that Windows NT uses when switching to kernel-mode to execute a system service. The description is for an x86 compatible CPU running in protected mode. Other platforms supported by Windows NT will have a similar mechanism for switching to kernel-mode.
By John Gulbrandsen 8/19/2004
John.Gulbrandsen@SummitSoftConsulting.com
What is kernel-mode?
Contrary to what most developers believe (even kernel-mode developers) there is no mode of the x86 CPU called “Kernel-mode”. Other CPUs such as the Motorola 68000 has two processor modes “built into” the CPU, i.e. it has a flag in a status register that tells the CPU if it is currently executing in user-mode or supervisor-mode. Intel x86 CPUs do not have such a flag. Instead, it is the privilege level of the code segment that is currently executing that determines the privilege level of the executing program. Each code segment in an application that runs in protected mode on an x86 CPU is described by an 8 byte data structure called a Segment Descriptor. A segment descriptor contains (among other information) the start address of the code segment that is described by the descriptor, the length of the code segment and the privilege level that the code in the code segment will execute at. Code that executes in a code segment with a privilege level of 3 is said to run in user mode and code that executes in a code segment with a privilege level of 0 is said to execute in kernel mode. In other words, kernel-mode (privilege level 0) and user-mode (privilege level 3) are attributes of the code and not of the CPU. Intel calls privilege level 0 “Ring 0” and privilege level 3 “Ring 3”. There are two more privilege levels in the x86 CPU that are not used by Windows NT (ring 1 and 2). The reason privilege levels 1 and 2 are not used is because Windows NT was designed to run on several other hardware platforms that may or may not have four privilege levels like the Intel x86 CPU.
The x86 CPU will not allow code that is running at a lower privilege level (numerically higher) to call into code that is running at a higher privilege level (numerically lower). If this is attempted a general protection (GP) exception is automatically generated by the CPU. A general protection exception handler in the operating system will be called and the appropriate action can be taken (warn the user, terminate the application etc). Note that all memory protection discussed above, including the privilege levels, are features of the x86 CPU and not of Windows NT. Without the support from the CPU Windows NT cannot implement memory protection like described above.
Where do the Segment Descriptors reside?
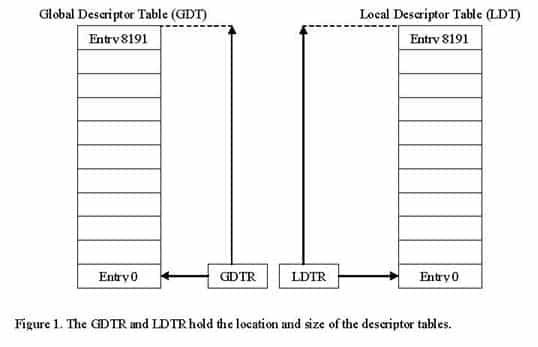
Since each code segment that exists in the system is described by a segment descriptor and since there are potentially many, many code segments in a system (each program may have many) the segment descriptors must be stored somewhere so that the CPU can read them in order to accept or deny access to a program that wishes to execute code in a segment. Intel did not choose to store all this information on the CPU chip itself but instead in the main memory. There are two tables in main memory that store segment descriptors; the Global Descriptor Table (GDT) and the Local Descriptor Table (LDT). There are also two registers in the CPU that holds the addresses to and sizes of these descriptor tables so that the CPU can find the segment descriptors. These registers are the Global Descriptor Table Register (GDTR) and the Local Descriptor Table Register (LDTR). It is the operating system’s responsibility to set up these descriptor tables and to load the GDTR and LDTR registers with the addresses of the GDT and LDT respectively. This has to be done very early in the boot process, even before the CPU is switched into protected mode, because without the descriptor tables no memory segments can be accessed in protected mode. Figure 1 below illustrates the relationship between the GDTR, LDTR, GDT and the LDT.
Since there are two segment descriptor tables it is not enough to use an index to uniquely select a segment descriptor. A bit that identifies in which of the two tables the segment descriptor resides is necessary. The index combined with the table indicator bit is called a segment selector. The segment selector format is displayed below.
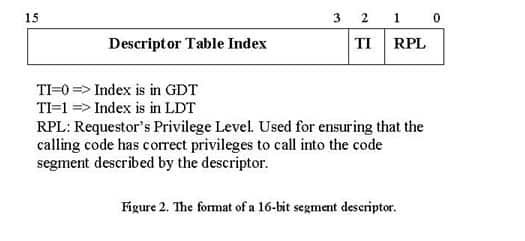
As can be seen in figure 2 above, the segment selector also contains a two-bit field called a Requestor Privilege Level (RPL). These bits are used to determine if a certain piece of code can access the code segment descriptor that the selector points to. For instance, if a piece of code that runs at privilege level 3 (user mode) tries to make a jump or call code in the code segment that is described by the code segment descriptor that the selector points to and the RPL in the selector indicates that only code that runs at privilege level 0 can read the code segment a general protection exception occurs. This is the way the x86 CPU can make sure that no ring 3 (user mode) code can get access to ring 0 (kernel-mode) code. In fact, the truth is slightly more complicated than this. For the information-eager please see the further reading list, “Protected Mode Software Architecture” for the details of the RPL field. For our purposes it is enough to know that the RPL field is used for privilege checks of the code trying to use the segment selector to read a segment descriptor.
Interrupt gates
So if application code running in user-mode (at privilege level 3) cannot call code running in kernel-mode (at privilege level 0) how do system calls in Windows NT work? The answer again is that they use features of the CPU. In order to control transitions between code executing at different privilege levels, Windows NT uses a feature of the x86 CPU called an interrupt gate. In order to understand interrupt gates we must first understand how interrupts are used in an x86 CPU executing in protected mode.
Like most other CPUs, the x86 CPU has an interrupt vector table that contains information about how each interrupt should be handled. In real-mode, the x86 CPU’s interrupt vector table simply contains pointers (4 byte values) to the Interrupt Service Routines that will handle the interrupts. In protected-mode, however, the interrupt vector table contains Interrupt Gate Descriptors which are 8 byte data structures that describe how the interrupt should be handled. An Interrupt Gate Descriptor contains information about what code segment the Interrupt Service Routine resides in and where in that code segment the ISR starts. The reason for having an Interrupt Gate Descriptor instead of a simple pointer in the interrupt vector table is the requirement that code executing in user-mode cannot directly call into kernel-mode. By checking the privilege level in the Interrupt Gate Descriptor the CPU can verify that the calling application is allowed to call the protected code at well defined locations (this is the reason for the name “Interrupt Gate”, i.e. it is a well defined gate through which user-mode code can transfer control to kernel-mode code).
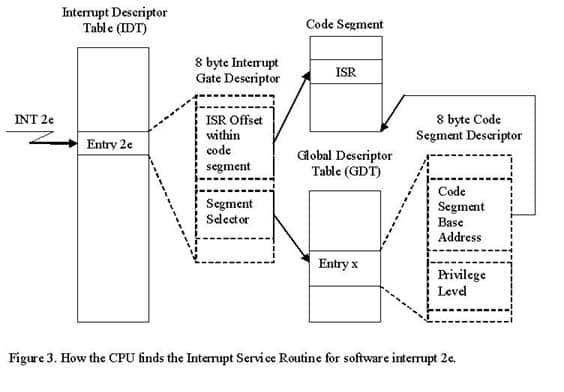
The Interrupt Gate Descriptor contains a Segment Selector which uniquely defines the Code Segment Descriptor that describes the code segment that contains the Interrupt Service Routine. In the case of our Windows NT system call, the segment selector points to a Code Segment Descriptor in the Global Descriptor Table. The Global Descriptor Table contains all Segment Descriptors that are “global”, i.e. that are not associated with any particular process running in the system (in other words, the GDT contains Segment Descriptors that describe operating system code and data segments). See figure 3 below for the relationship between the Interrupt Descriptor Table Entry associated with the ‘int 2e’ instruction, the Global Descriptor Table Entry and the Interrupt Service Routine in the target code segment.
Back to the NT system call
Now after having covered the background material we are ready to describe exactly how a Windows NT system call finds its way from user-mode into kernel-mode. System calls in Windows NT are initiated by executing an “int 2e” instruction. The ‘int’ instructor causes the CPU to execute a software interrupt, i.e. it will go into the Interrupt Descriptor Table at index 2e and read the Interrupt Gate Descriptor at that location. The Interrupt Gate Descriptor contains the Segment Selector of the Code Segment that contains the Interrupt Service Routine (the ISR). It also contains the offset to the ISR within the target code segment. The CPU will use the Segment Selector in the Interrupt Gate Descriptor to index into the GDT or LDT (depending on the TI-bit in the segment selector). Once the CPU knows the information in the target segment descriptor it loads the information from the segment descriptor into the CPU. It also loads the EIP register from the Offset in the Interrupt Gate Descriptor. At this point the CPU is almost set up to start executing the ISR code in the kernel-mode code segment.
The CPU switches automatically to the kernel-mode stack
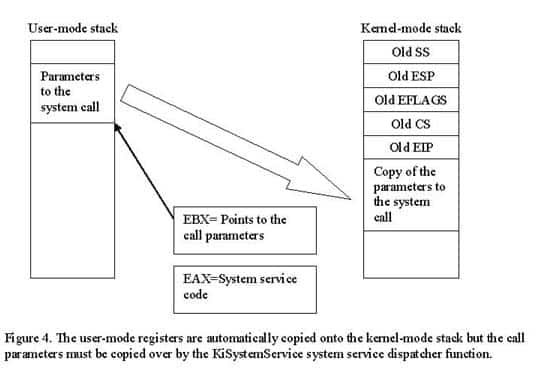
Before the CPU starts to execute the ISR in the kernel-mode code segment, it needs to switch to the kernel-mode stack. The reason for this is that the kernel-mode code cannot trust the user-mode stack to have enough room to execute the kernel-mode code. For instance, malicious user-mode code could modify its stack pointer to point to invalid memory, execute an ‘int 2e’ instruction and thereby crash the system when the kernel-mode functions uses the invalid stack pointer. Each privilege level in the x86 Protected Mode environment therefore has its own stack. When making function calls to a higher-privileged level through an interrupt gate descriptor like described above, the CPU automatically saves the user-mode program’s SS, ESP, EFLAGS, CS and EIP registers on the kernel-mode stack. In the case of our Windows NT system service dispatcher function (KiSystemService) it needs access to the parameters that the user-mode code pushed onto its stack before it called ‘int 2e’. By convention, the user-mode code must set up the EBX register to contain a pointer to the user-mode stack’s parameters before executing the ‘int 2e’ instruction. The KiSystemService can then simply copy over as many arguments as the called system function needs from the user-mode stack to the kernel-mode stack before calling the system function. See figure 4 below for an illustration of this.
What system call are we calling?
Since all Windows NT system calls use the same ‘int 2e’ software interrupt to switch into kernel-mode, how does the user-mode code tell the kernel-mode code what system function to execute? The answer is that an index is placed in the EAX register before the int 2e instruction is executed. The kernel-mode ISR looks in the EAX register and calls the specified kernel-mode function if all parameters passed from user-mode appears to be correct. The call parameters (for instance passed to our OpenFile function) are passed to the kernel-mode function by the ISR.
Returning from the system call
Once the system call has completed the CPU automatically restores the running program’s original registers by executing an IRET instruction. This pops all the saved register values from the kernel-mode stack and causes the CPU to continue the execution at the point in the user-mode code next after the ‘int 2e’ call.
Experiment
By examining the Interrupt Gate Descriptor for entry 2e in the Interrupt Descriptor Table we can confirm that the CPU finds the Windows NT system service dispatcher routine like described in this article. The code sample for this article contains a debugger extension for the WinDbg kernel-mode debugger that dumps out a descriptor in the GDT, LDT or IDT.
Download the example code: ProtMode.zip
The WinDbg debugger extension is a DLL called ‘protmode.dll’ (Protected Mode). It is loaded into WinDbg by using the following command: “.load protmode.dll” after having copied the DLL into the directory that contains the kdextx86.dll for our target platform. Break into the WinDbg debugger (CTRL-C) once you are connected to your target platform. The syntax for displaying the IDT descriptor for ‘int 2e’ is “!descriptor IDT 2e”. This dumps out the following information:
kd>!descriptor IDT 2e
------------------- Interrupt Gate Descriptor --------------------
IDT base = 0x80036400, Index =    0x2e, Descriptor @ 0x80036570
80036570 c0 62 08 00 00 ee 46 80
Segment is present, DPL = 3, System segment, 32-bit descriptor
Target code segment selector =    0x0008 (GDT Index = 1, RPL = 0)
Target code segment offset =      0x804662c0
------------------- Code Segment Descriptor --------------------
GDT base = 0x80036000, Index =    0x01, Descriptor @ 0x80036008
80036008 ff ff 00 00 00 9b cf 00
Segment size is in 4KB pages, 32-bit default operand and data size
Segment is present, DPL =         0, Not system segment, Code segment
Segment is not conforming, Segment is readable, Segment is accessed
Target code segment base address =     0x00000000
Target code segment size = 0x000fffff
The ‘descriptor’ command reveals the following:
- The descriptor at index 2e in the IDT is at address 0x80036570.
- The raw descriptor data is C0 62 08 00 00 EE 46 80.
- This means that:
- The segment that contains the Code Segment Descriptor described by the Interrupt Gate Descriptor’s Segment Selector is present.
- Code running at least privilege level 3 can access this Interrupt Gate.
- The Segment that contains the interrupt handler for our system call (2e) is described by a Segment Descriptor residing at index 1 in the GDT.
- The KiSystemService starts at offset 0x804552c0 within the target segment.
The “!descriptor IDT 2e” command also dumps out the target code segment descriptor at index 1 in the GDT. This is an explanation of the data dumped from the GDT descriptor:
- The Code Segment Descriptor at index 1 in the GDT is at address 0x80036008.
- The raw descriptor data is FF FF 00 00 00 9B CF 00.
- This means that:
- The size is in 4KB pages. What this means is that the size field (0x000fffff) should be multiplied with the virtual memory page size (4096 bytes) to get the actual size of the segment described by the descriptor. This yields 4GB which happens to be the size of the full address space which can be accessed from kernel-mode. In other words, the whole 4GB address space is described by this segment descriptor. This is the reason kernel-mode code can access any address in user-mode as well as in kernel-mode.
- The segment is a kernel-mode segment (DPL=0).
- The segment is not conforming. See further reading, “Protected Mode Software Architecture” for a full discussion of this field.
- The segment is readable. This means that code can read from the segment. This is used for memory protection. See further reading, “Protected Mode Software Architecture” for a full discussion of this field.
- The segment has been accessed. See further reading, “Protected Mode Software Architecture” for a full discussion of this field.
To build the ProtMode.dll WinDbg debugger extension DLL, open the project in Visual Studio 6.0 and click build. For an introduction of how to create debugger extensions like ProtMode.dll, see the SDK that comes with the “Debugging Tools for Windows” which is a free download from Microsoft.
Further Reading
For information on the Protected Mode of the Intel x86 CPU there are two great sources:
- “Intel Architecture Software Developers Manual, Volume 3 – System Programming Guide”. Available from Intel’s web site in PDF format.
- “Protected Mode Software Architecture” by Tom Shanley. Available from Amazon.com (published by Addison Wesley).
For more programming details about the x86 CPU, must-haves are:
- Intel Architecture Software Developers Manual, Volume 1 – Basic Architecture.
- Intel Architecture Software Developers Manual, Volume 2 – Instruction Set Reference Manual.
Both these books are available in PDF format on the Intel web site (you can also get a free hardcopy of these two books. Volume 3 is however only available in PDF format).
About the Author
John Gulbrandsen is the founder and president of Summit Soft Consulting. John has a formal background in Microprocessor-, digital- and analog- electronics design as well as in embedded and Windows systems development. John has programmed Windows since 1992 (Windows 3.0). He is as comfortable with programming Windows applications and web systems in C++, C# and VB as he is writing and debugging Windows kernel mode device drivers in SoftIce.
To contact John drop him an email: John.Gulbrandsen@SummitSoftConsulting.com
About Summit Soft Consulting
Summit Soft Consulting is a Southern California-based consulting firm specializing in Microsoft’s operating systems and core technologies. Our specialty is Windows Systems Development including kernel mode and NT internals programming.
To visit Summit Soft Consulting on the web: http://www.summitsoftconsulting.com